We are sorry that your task failed. This page provides some steps to get you back on track. We recommend that you first check the three most common reasons why tasks fail then look at the error message on the Task page. If you are still stuck, please [inspect the task logs](#task logs).
Common reasons for failed tasks
The most common reasons for failed tasks are:
Missing input files
Double-check that you've supplied all required input files. The tools used in your task may require a reference file or input files of a particular format. See the CGC documentation on inputting files to tasks.
Missing or incorrect metadata
Tasks often fail if you haven't supplied metadata for your input files. See the CGC documentation on metadata for more information on metadata fields that are supported on the CGC. If your task involves a tool that you have wrapped using Rabix, make sure that you've configured it to annotate outputs with metadata if the outputs will be used by a downstream tool.
Missing or incorrect parameters for a tool
The tools used in your workflow may require you to specify certain parameters in order to run them together in a workflow. To understand your tool's parameter settings, you should consult the tool manual. Then, to learn more about changing the parameters for a tool, see the Platform documentation on defining app settings.
If these three reasons do not seem applicable to your task failure, please check the error message on the Task page. If the error message doesn't help fix the problem, you can also [check the task logs](#task logs).
Check the Task page error message
You can access the Task page by clicking the link in the email which notified you of the task failure. Alternatively, you can navigate to the Task page by logging into your account on the CGC, clicking on your project's name under Projects, then selecting the Tasks tab. The failed task will be marked as FAILED. To open the Task page, click the task's name.
If your task failed, the Task page will display a red error message, as shown below.
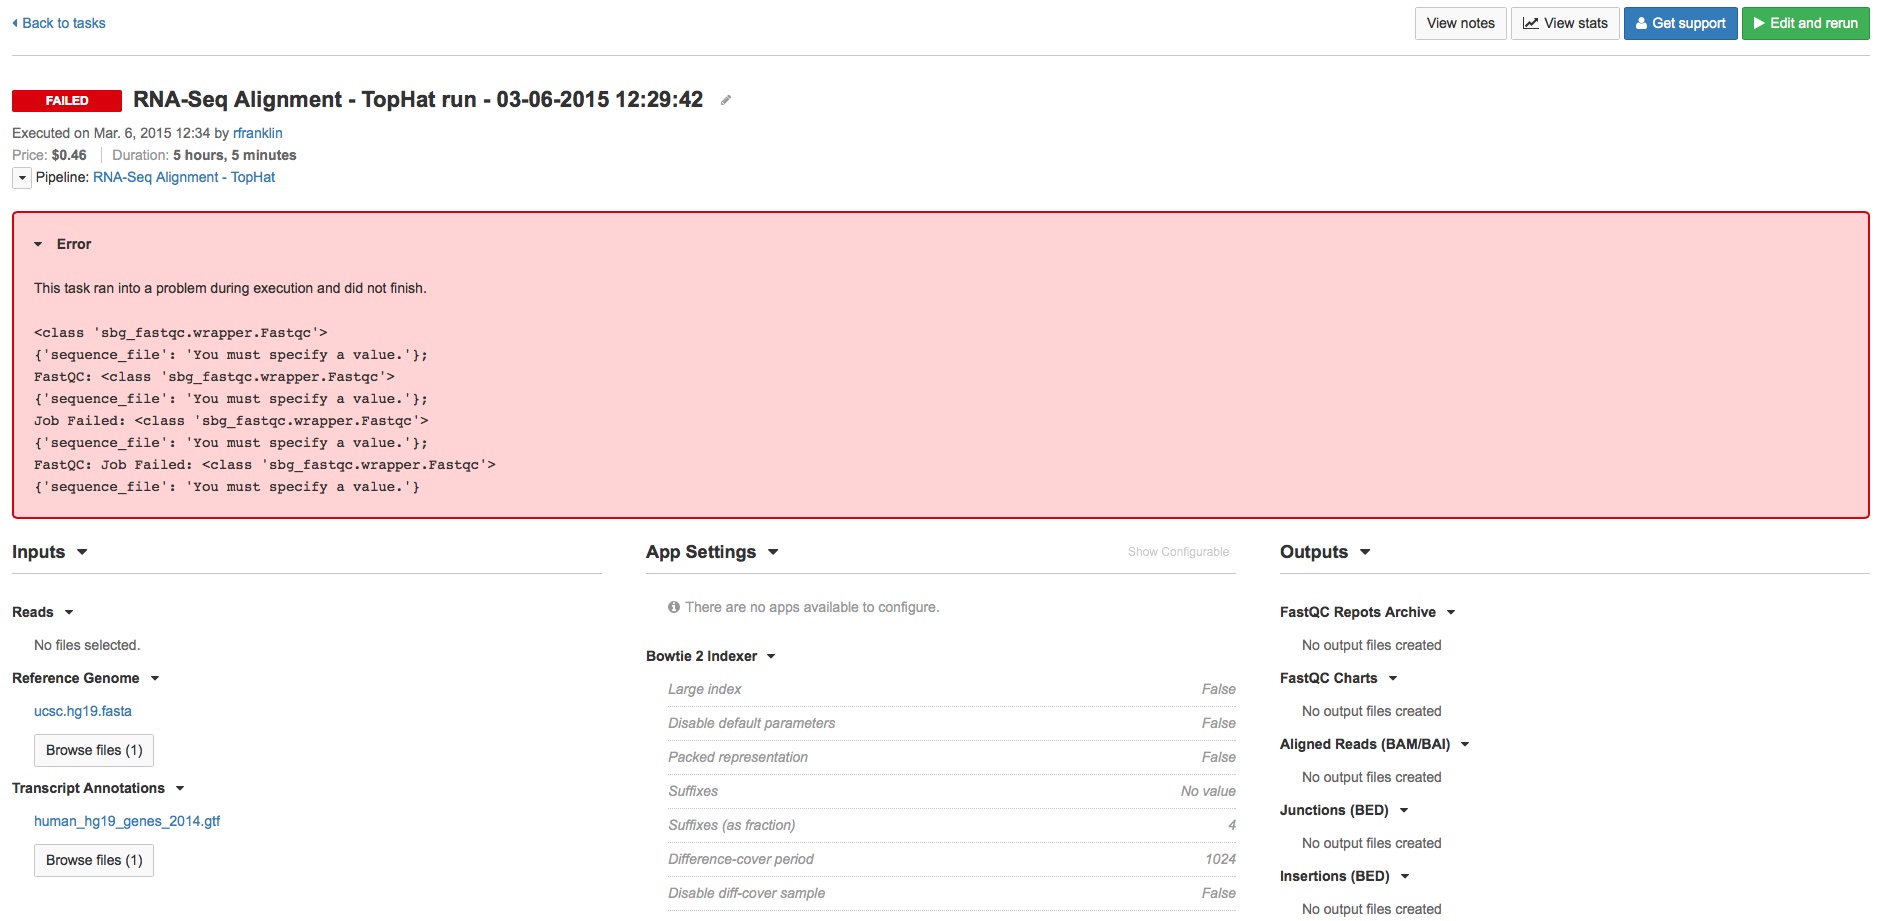
The red error message on the Task page displays errors produced by the tools used in the task. The text shown depends on the tools that were used. In some cases, the text will give a good indication of the error. In any case, the error should allow you to see which tools are causing the task to fail. In the example above, we can see that the problem was due to FastQC.
If you have located the reasons for the error at this point, you can click Edit and Rerun, located in the upper right corner of the task page. Then, amend the metadata, parameters, or input files, and click to Run the workflow once more.
If you are still unsure how to interpret the error message, you can go on to inspect the .err files in the task logs. Any standard error text produced by the tool will be written there.
Check Task logs
You can get more information about your task by inspecting the task statistics and standard error logs. To see these, click View stats located in the upper right corner of the task page. This will bring up the Task stats page, as shown below. The Task stats page shows a timeline of the apps executed in the task and details of their jobs.
The Task stats page allows you to debug a failed task by localizing the error to a particular tool:
- It indicates the particular job that failed in the task, by zooming into it on the task timeline.
- It allows you to access the task logs specifically for the failed task.
The execution of a tool is described in terms of its jobs. Jobs are sub-processes of a tool execution. They can be executed in series or parallel.
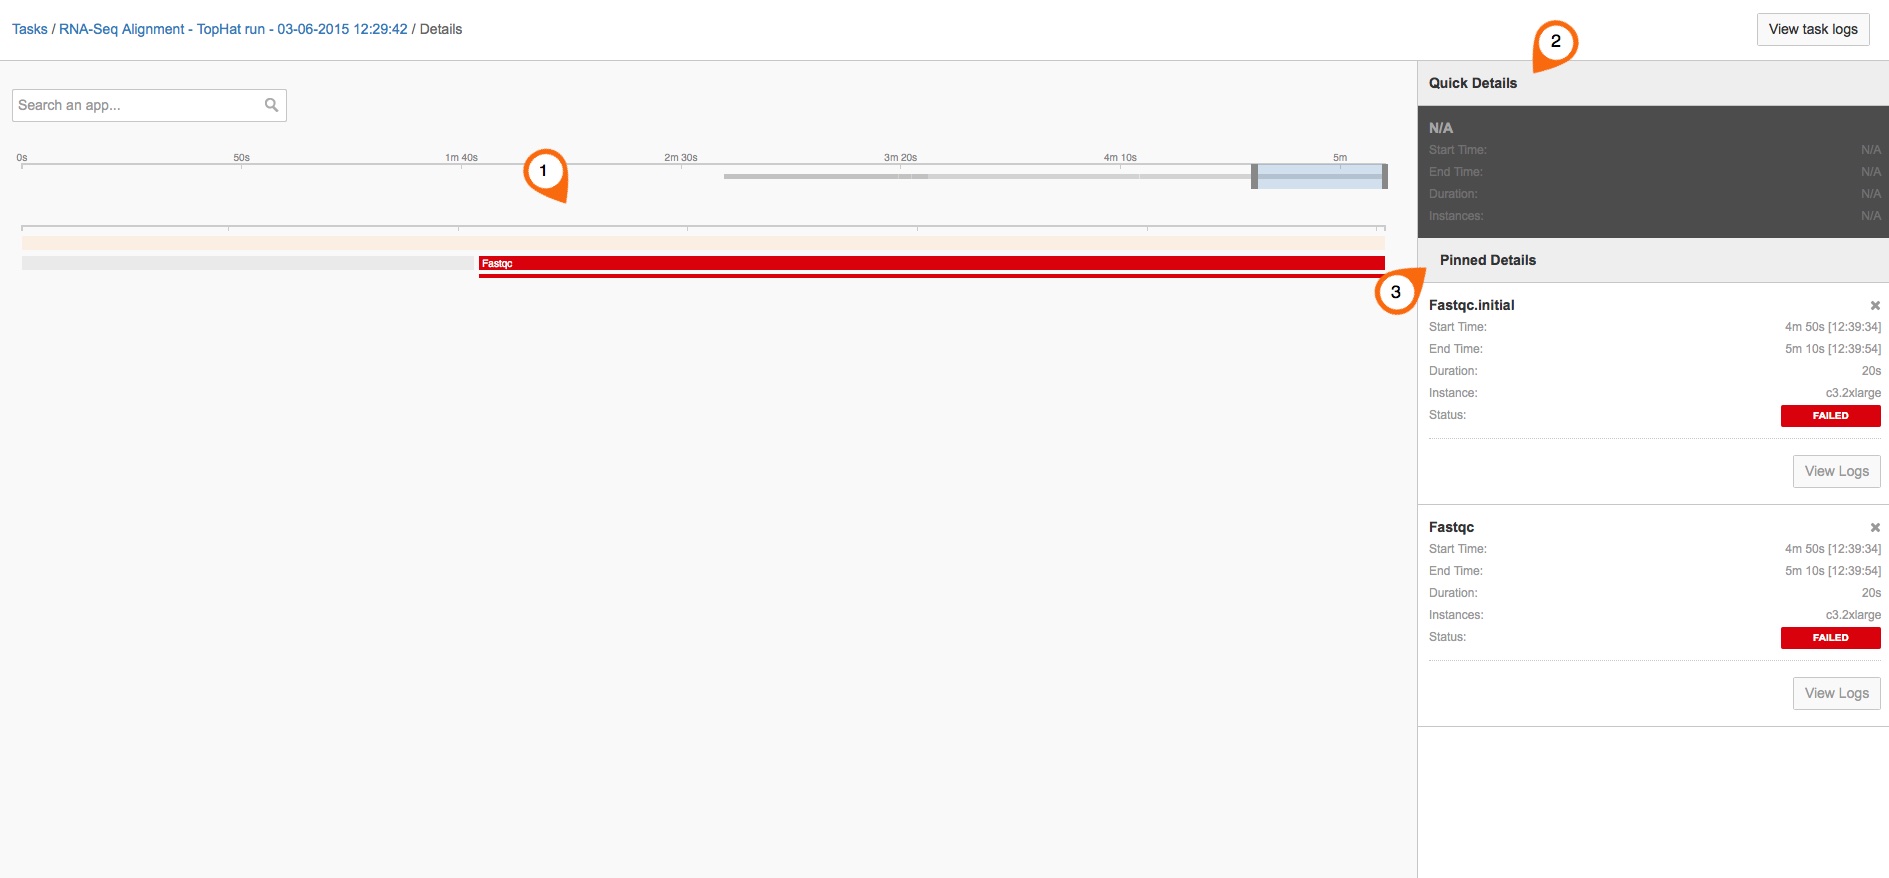
The Task stats page is divided into three main sections:
 The Task Timeline shows the timescale for all the apps that were executed in the task.
 Quick Details is a pop-up that appears when you hover over a tool or a job. It provides details and allows you to quickly see information about the tool of job.
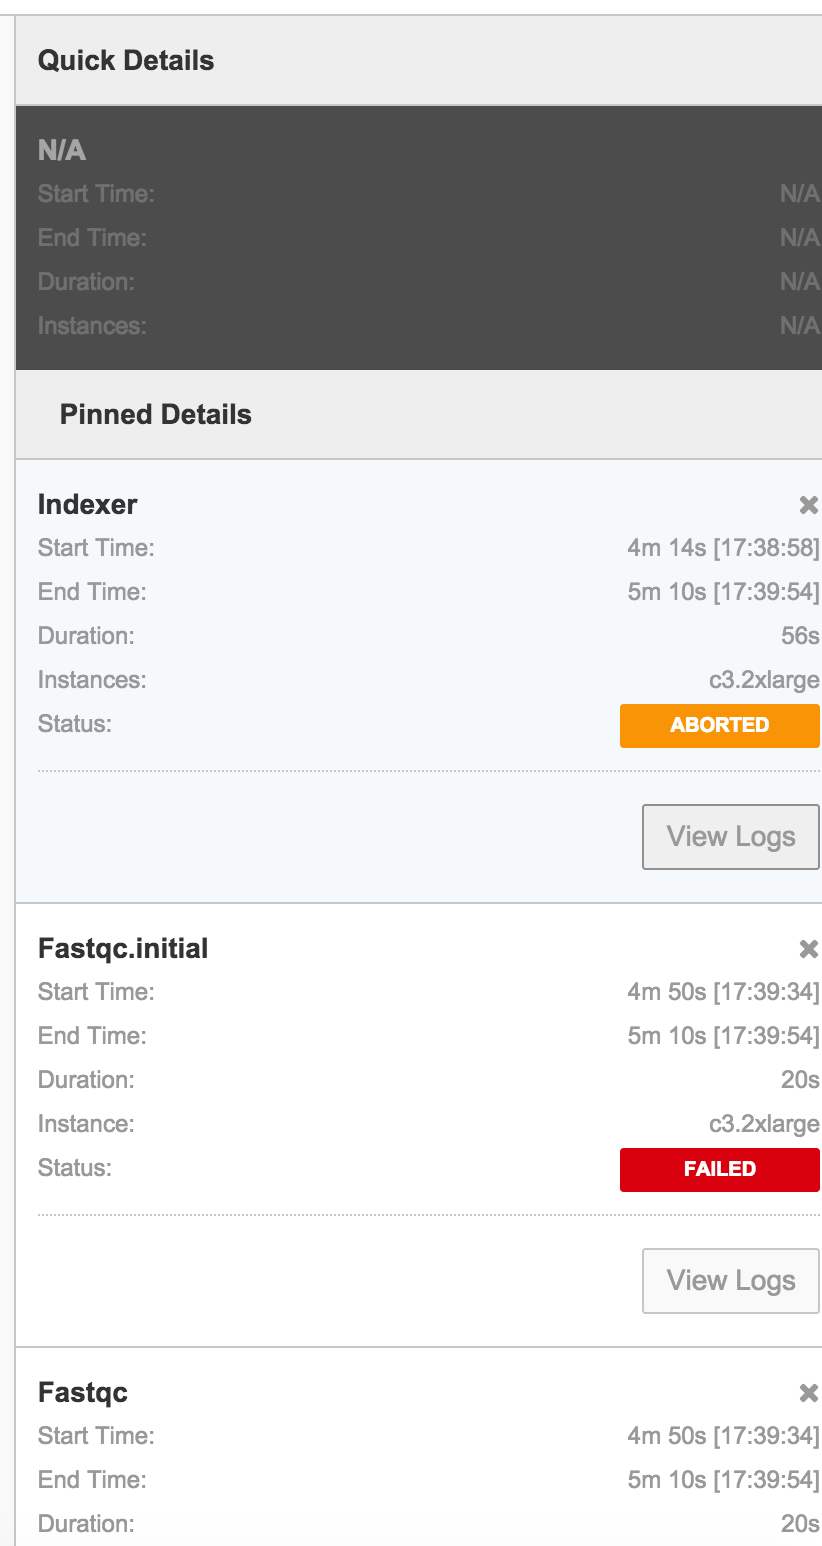
 Pinned Details displays in the right panel when you click on a tool or a job. It shows essentially the same information as Quick Details. If a tool fails, its Status will be marked as FAILED. Pinned Details allows you to 'pin' the details of multiple tools or jobs, so that you can compare them. More importantly, it also contains a link to the Task logs.
Learn more about the Task stats page.
On the Task stats page, you will see that the timeline is already zoomed into the tool that failed. When you click on this tool, you will see its Pinned Details on the right-hand panel. The panel also provides a link to the task logs that are specific to the tool. To see the logs, click View Logs in Pinned Details, as shown below.
Tool logs
An example of the Task logs for a tool is shown below. Logs are structured by tools and jobs. The file system is shown on the left panel of the Task logs page, and the log contents are shown in the right panel.
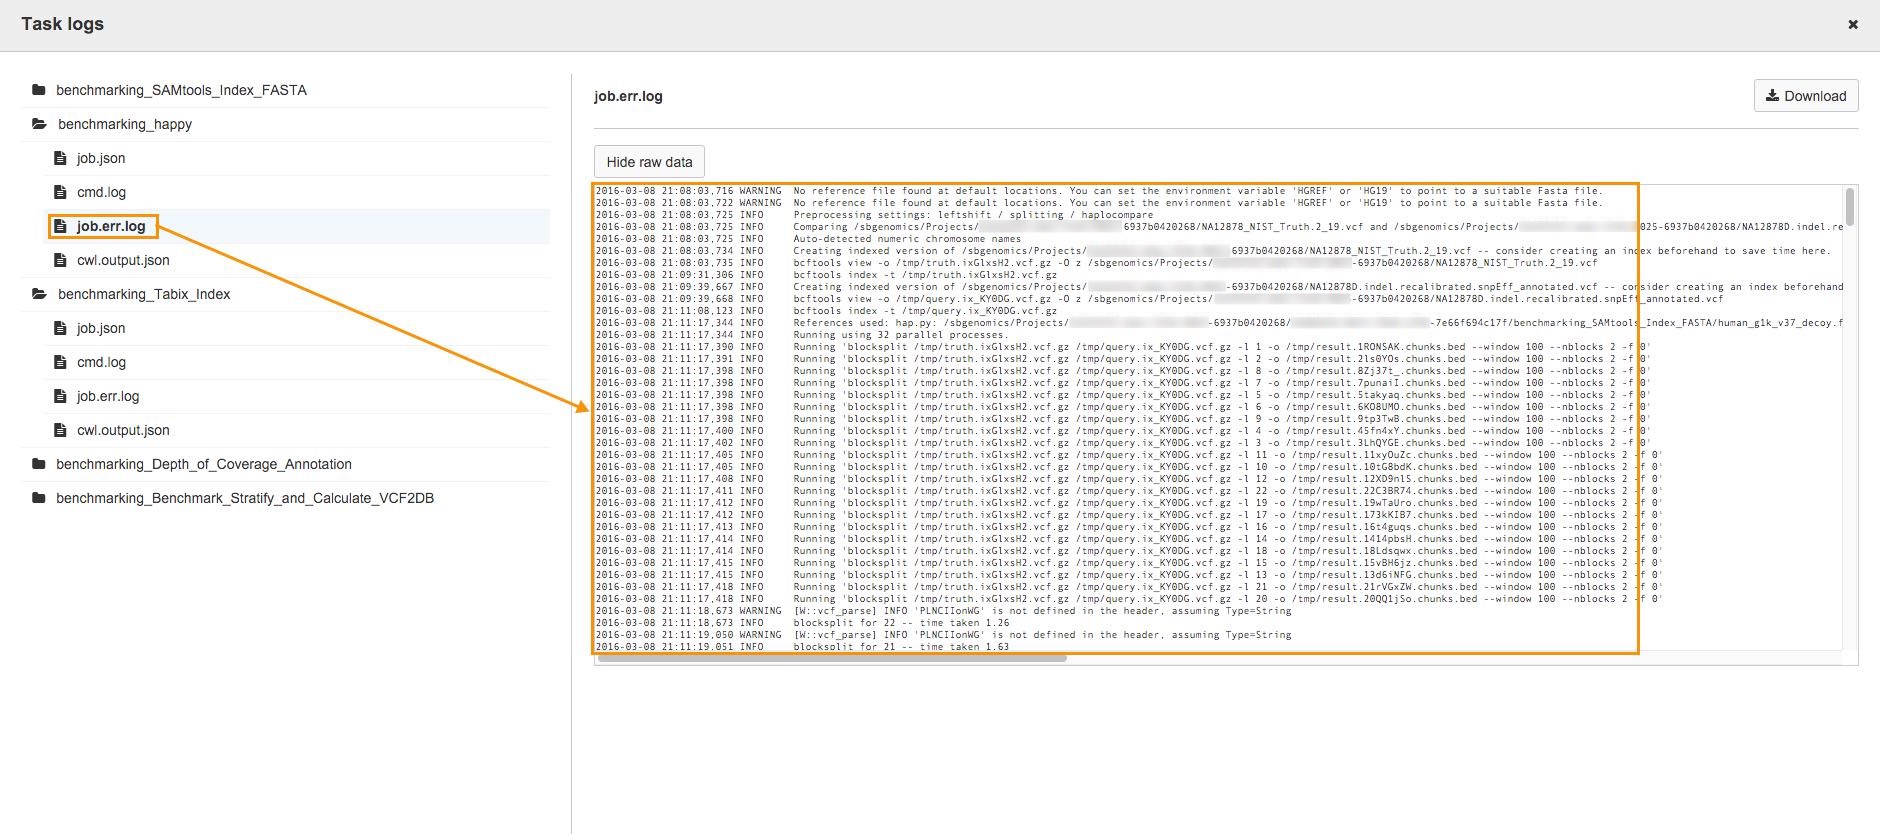
To understand why a task failed, it can be helpful to check the .err file, if one exists. The .err file will be named ‘process_x.err’, where ‘x’ is a number. Some bioinformatics tools have fairly user-friendly error messages which can help you fix errors even if you have no previous experience in programming. Unfortunately, other tools don't do error handling so well and require specific programming knowledge. A good first step if you don't understand part of the .err file is to use the error text as a search term online to find explanations from the research community.
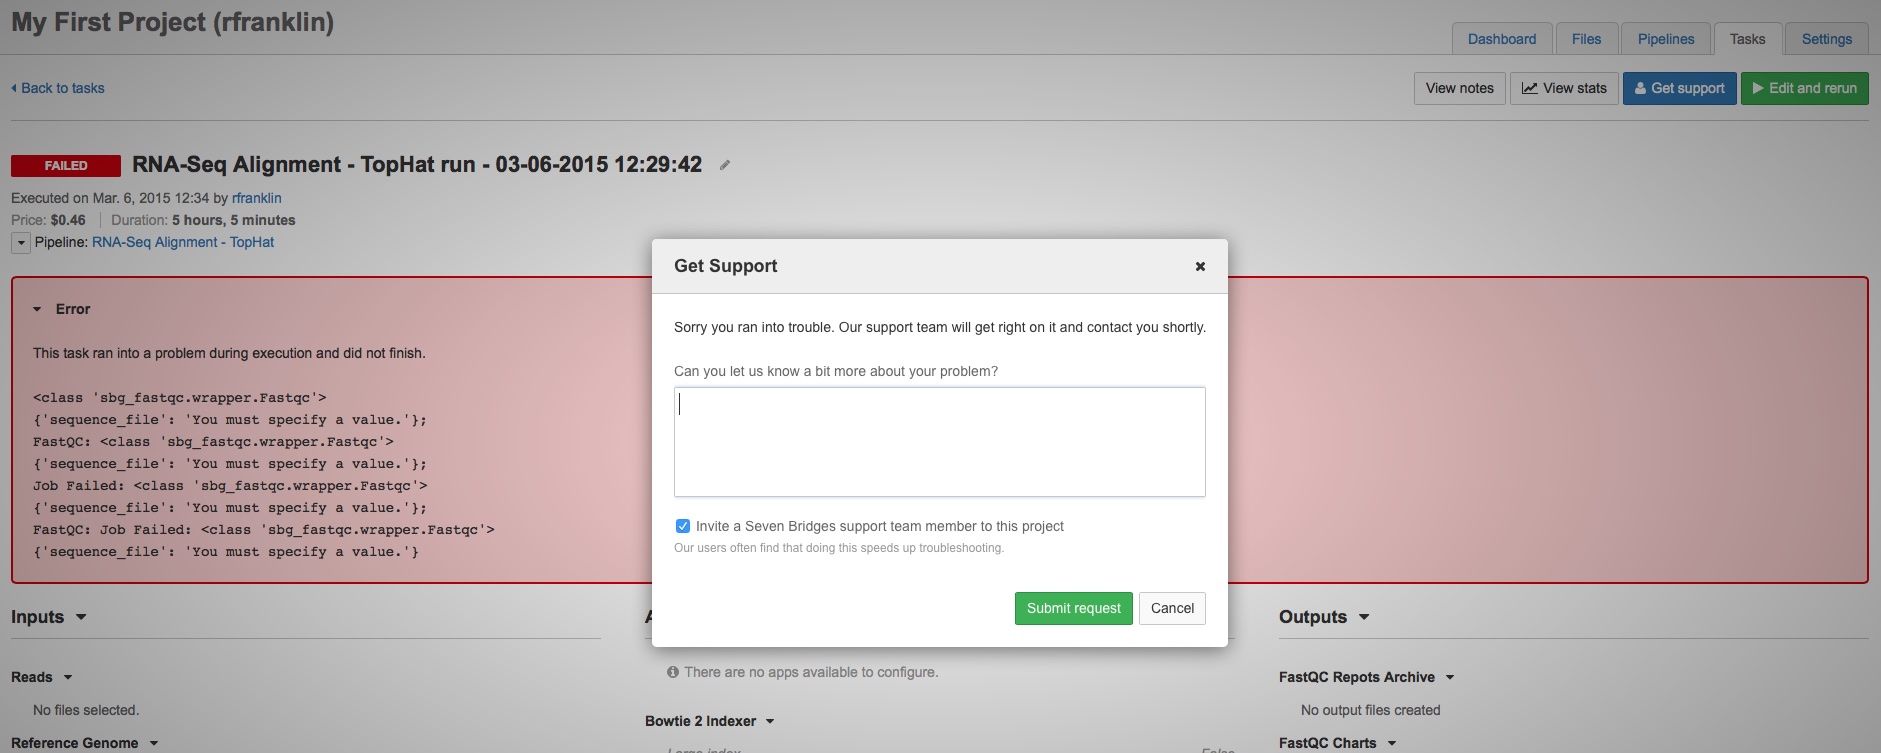
Don't forget that you also have the support of the Seven Bridges bioinformatics team: we are happy to investigate and debug any failed tasks. Please do not hesitate to contact us at any time by clicking Get support on the top right hand corner of the Task page. This will bring up a pop-up window, like the one shown below. Here you can enter a message for the bioinformatics team.
Seven Bridges treats data confidentially seriously, and our bioinformaticians cannot see any of your data unless you authorize them. To do this, when you click Get support, check the box labeled Invite a Seven Bridges support team member to this project, at the bottom of the pop-up window that appears.
Updated over 3 years ago
