
Uncontrolled Data QuickStart Guide
Cancer Genomics Cloud
Uncontrolled Data QuickStart Guide
Step 1: Project creation and setup
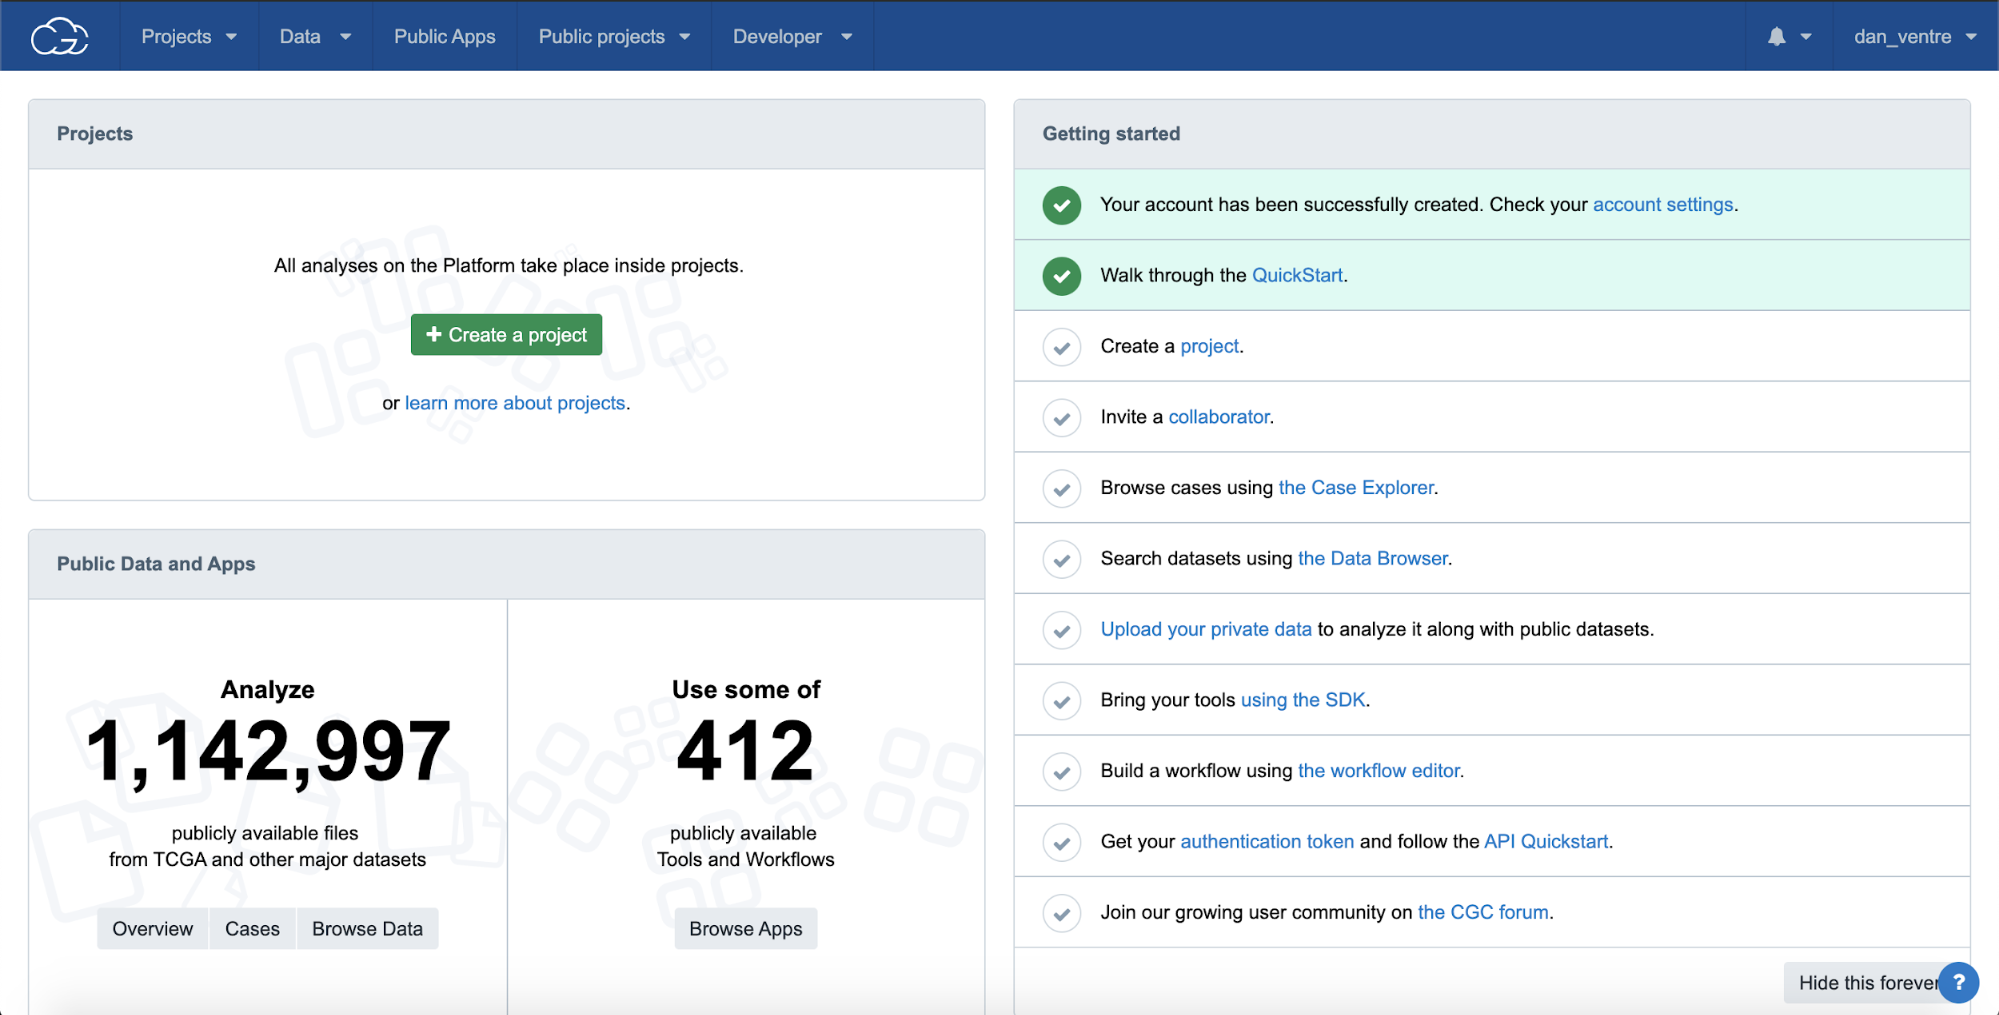
Let’s go through the steps of creating a project to learn more about the options of how they can be configured. Steps 1a-g describe how to create a project and adjust the settings that affect the whole project. Most of these will be the default value, and more detail on each field is provided below.
Step 1a. On the main dashboard, select the green “Create a project” button on the left-hand side of the screen.
Step 1a: Creating a Project from the Dashboard
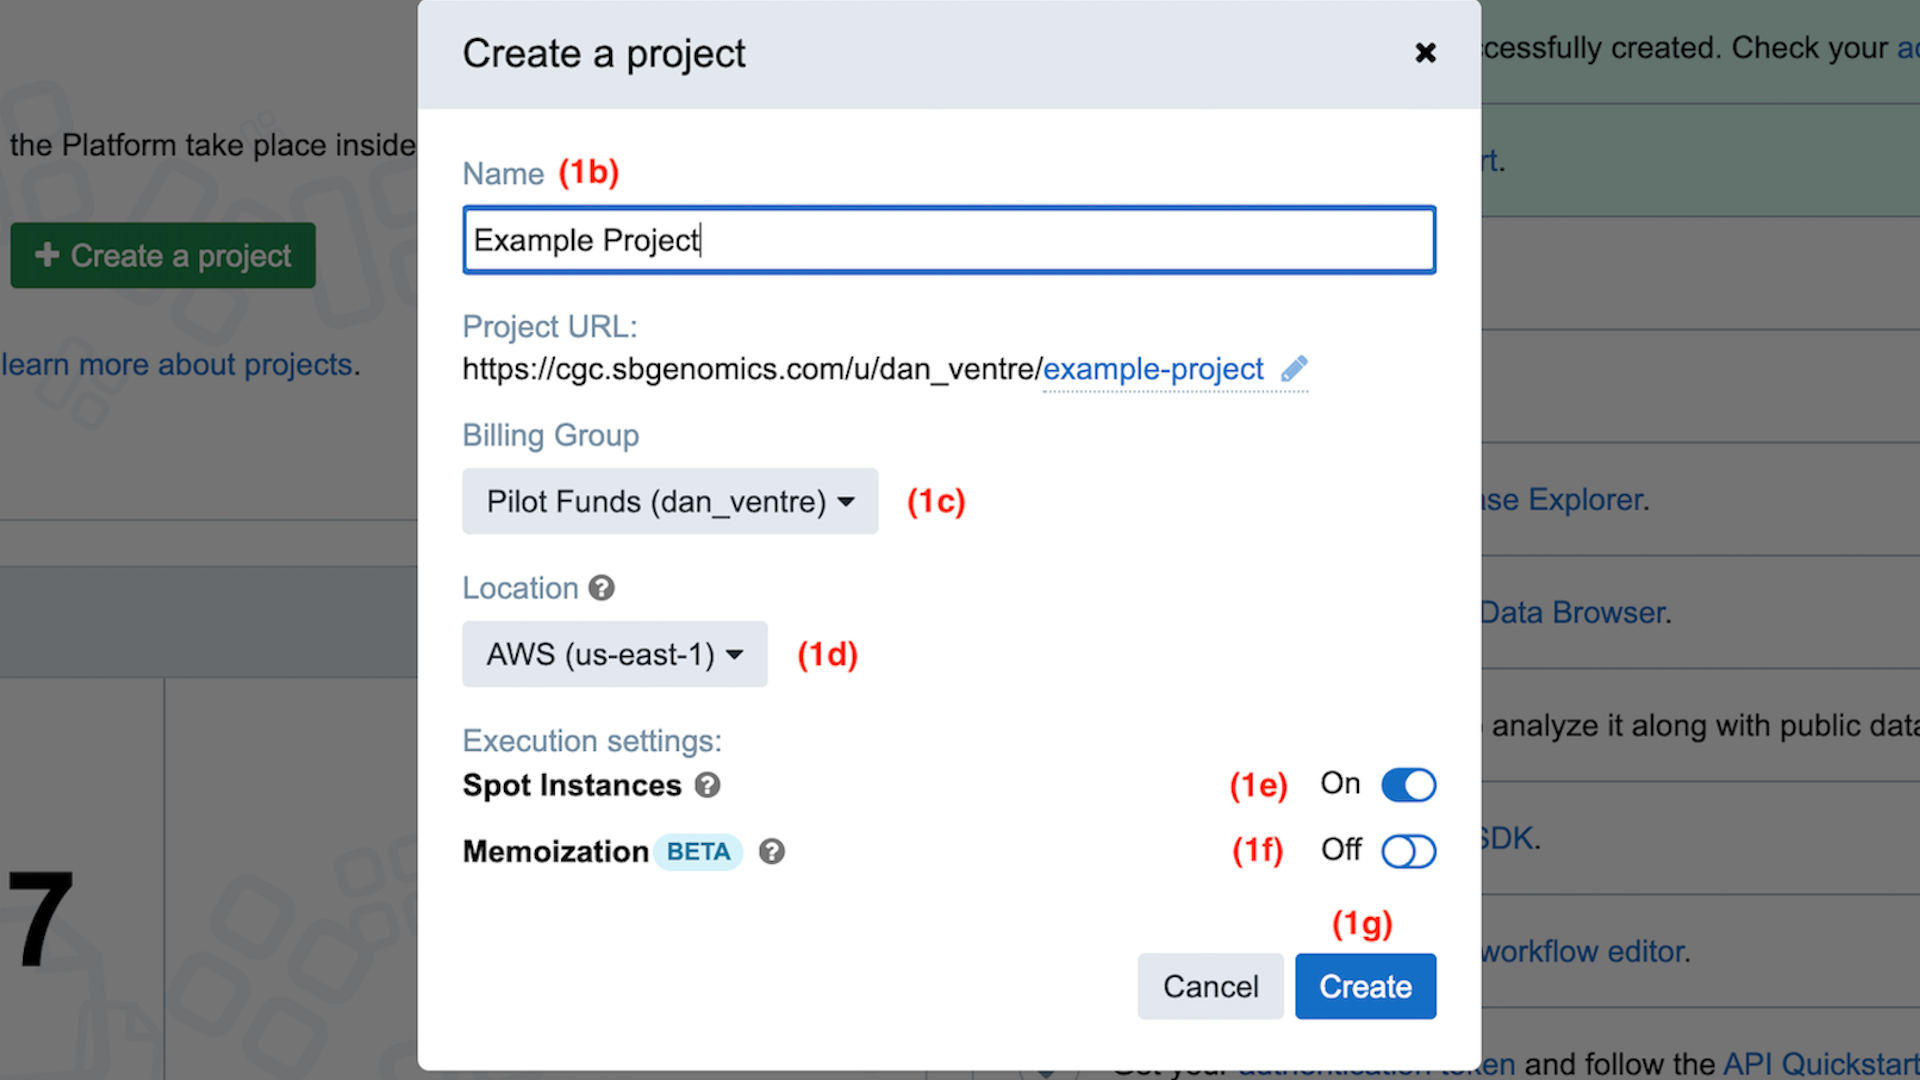
Name the project
Step 1b. Following along with the red step indicators in the screenshot below, we begin by picking a name for your project. In this guide, we will use “Example Project.” Type “Example Project” the first field.
Your project will be assigned a short name based on the name that you give it, which is used as an ID to refer to the project.
Step 1b-g: Create a project
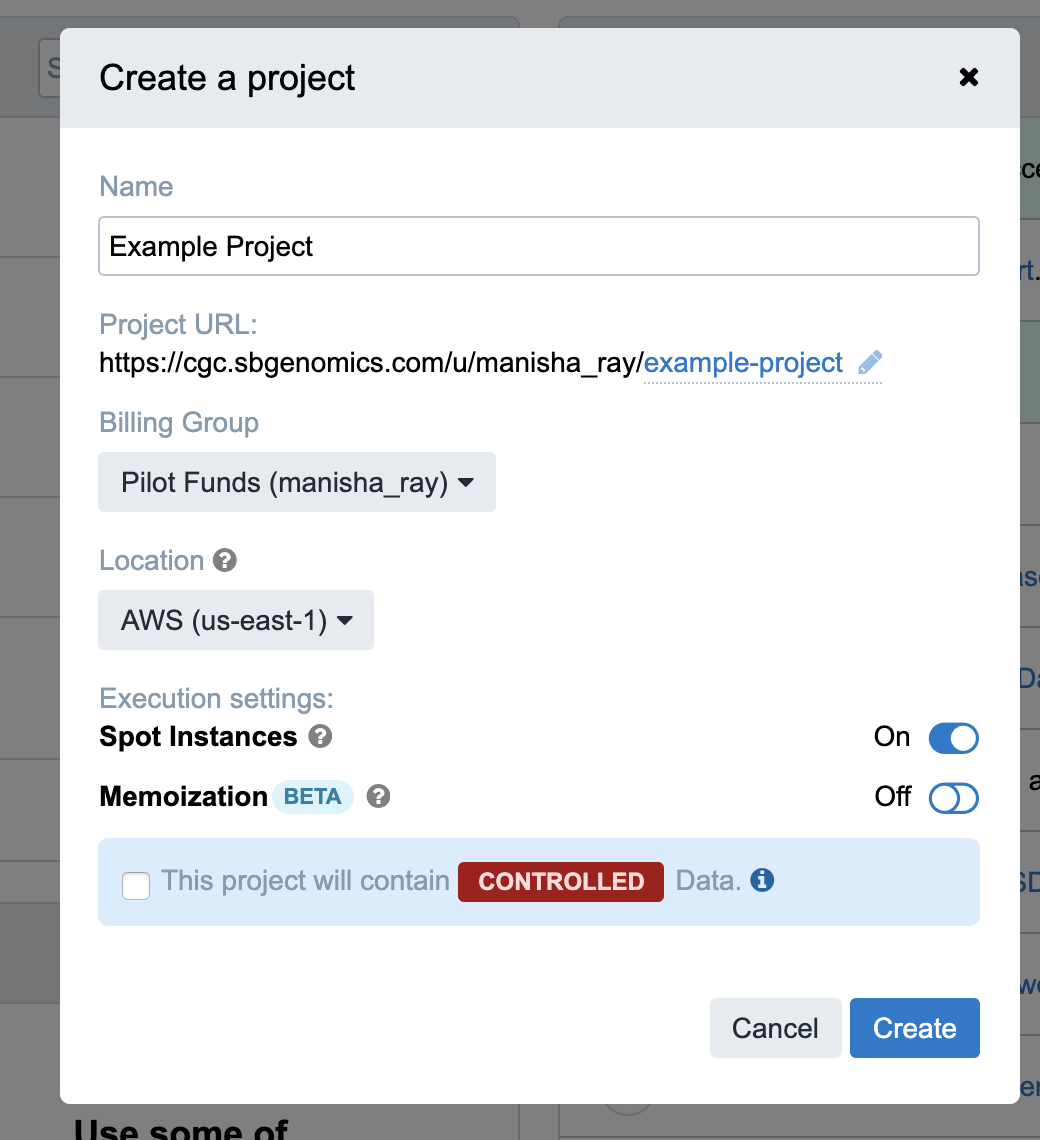
Note: Depending on your credentials, you may or may not see a Controlled data banner in red (see screenshot below). For the purposes of this tutorial, leave the Controlled data banner unchecked if it is visible.
Blling group
Billing groups are used to track the costs associated with cloud storage and computation on the platform. Each project must be assigned a billing group. New users are automatically assigned a “Pilot Funds” billing group upon account registration with $300 in cloud credits to get started with analyses. The Seven Bridges Support Team will reach out when you are close to using up your Pilot Funds and offer to create a new billing group for further work.
Step 1c. For this Example Project, select the “Pilot Funds” billing group from the dropdown menu, if it is not already selected by default.
Location
In an effort to enable you to compute on data where it lives, the platform offers the choice to perform computation on two different cloud locations (cloud provider and region): AWS us-east-1 and Google us-west-1. AWS us-east-1 is the default. When you create a new project, they can select one of these two cloud locations as the location for the project. All computation within the project will take place in this cloud location.
Step 1d. For this Example Project, select “AWS-us-east-1” as the cloud location from the dropdown menu, if it is not already selected by default.
Execution Settings
The first selection in the Execution Settings is whether to use a discounted type of computation instance on AWS or Google Cloud, which uses the cloud provider’s spare capacity. For AWS, the platform supports EC2 Spot instances. For Google, the platform supports Preemptible instances. Spot/Preemptible Instances are not recommended for running long, time-critical jobs.
Step 1e. For this Example Project, turn on “AWS Spot instances,” if it is not already selected by default.
The next selection for Execution Settings is whether to use memoization when running analyses. Memoization allows researchers and bioinformaticians to restart from a point of failure in a workflow by enabling the reuse of existing outputs.
Step 1f. For this Example Project, turn off “Memoization,” if it is not already off by default.
Finalize
Step 1g. Once you have gone through all of these settings, click the blue “Create” button.
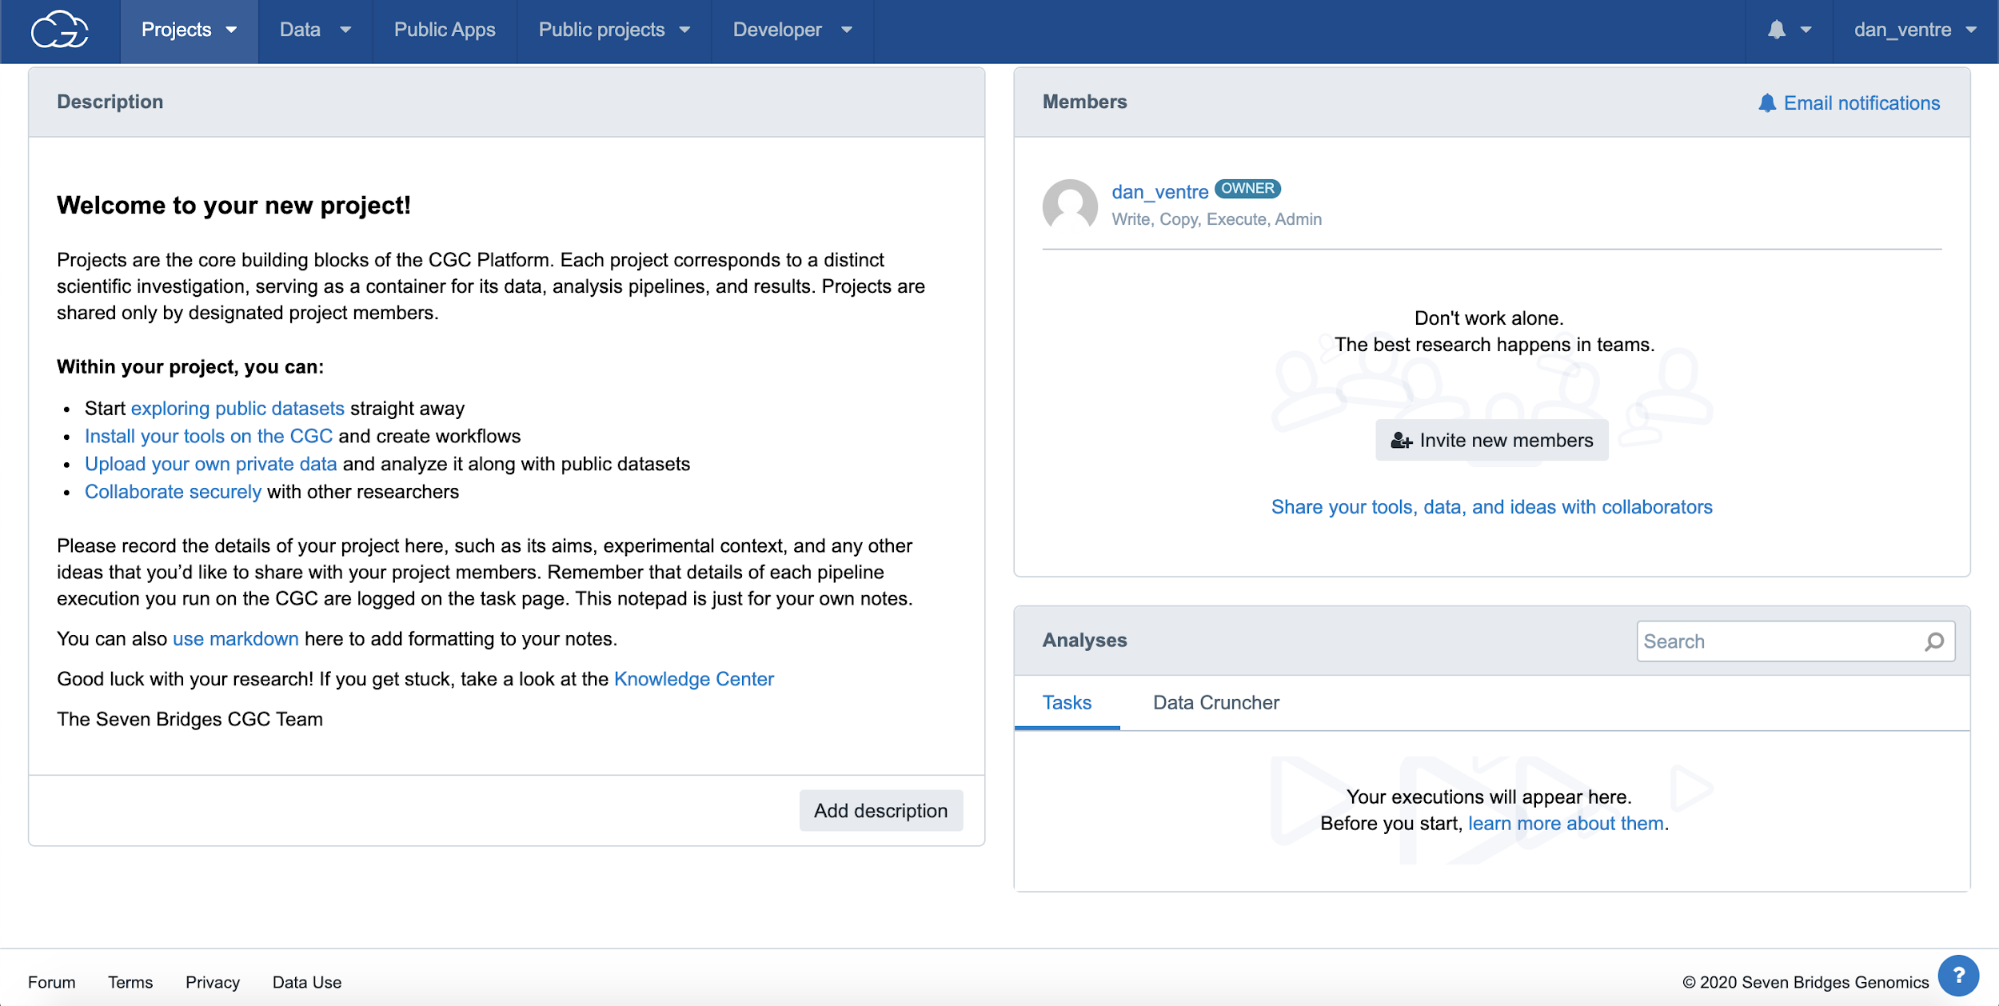
This will take you to the Project Dashboard, shown in the screenshot below.
Step 2: Project Dashboard and adding files
Single executions of bioinformatics tools and workflows on the platform are called “Tasks.” All Tasks are run from within projects. We will set up an example Task using the FastQC workflow.
Step 2: Project Dashboard
Adding files to project
There are many routes to adding data files to your project for analysis, including public files and uploading your own files. For this tutorial, we will be working with public data that is “uncontrolled,” as opposed to controlled-access patient data.
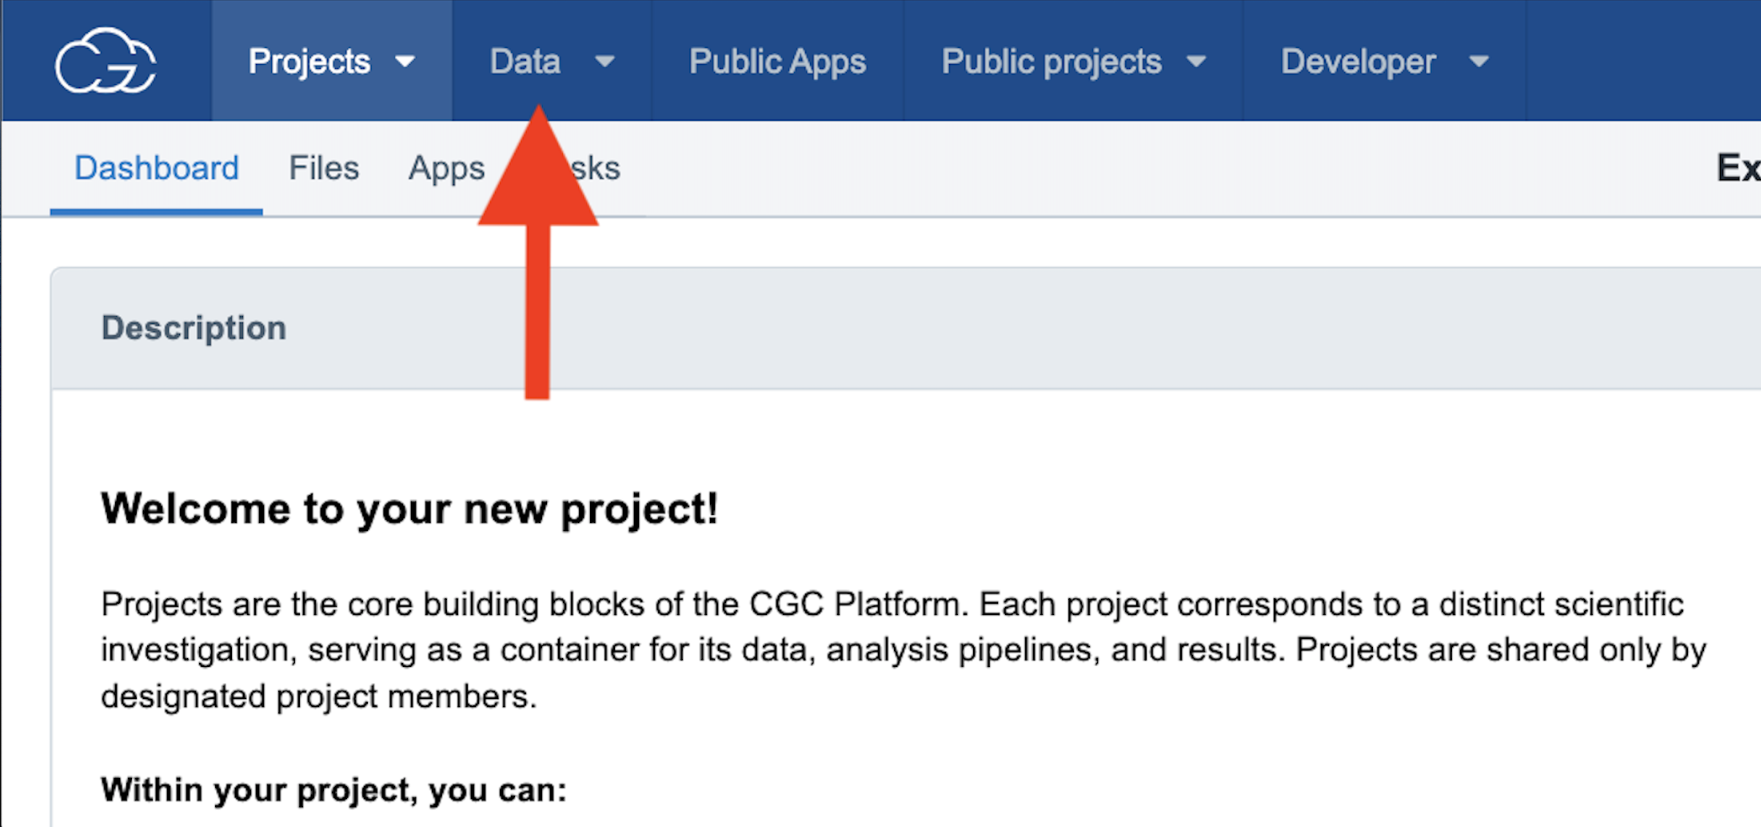
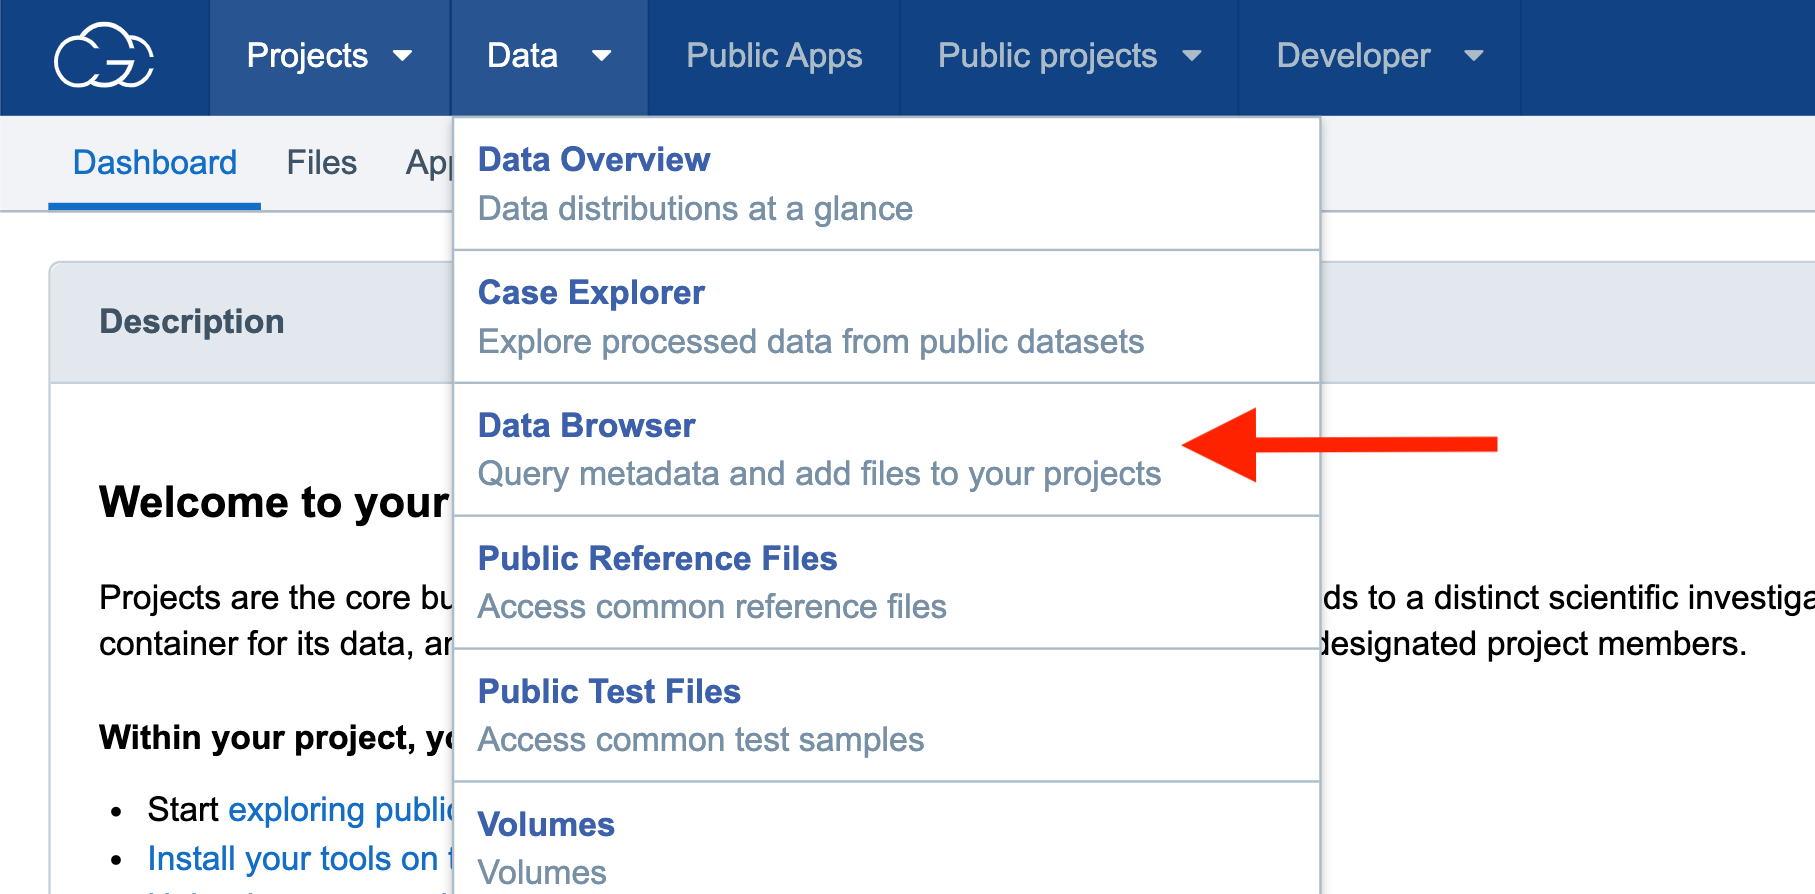
Step 2a. To find data to use for this example analysis, navigate to “Data” on the top menu bar and then select the “Data Browser.” This will bring you to a page that contains all the datasets available on the CGC for the query.
Step 2a: Navigating to the Data Browser
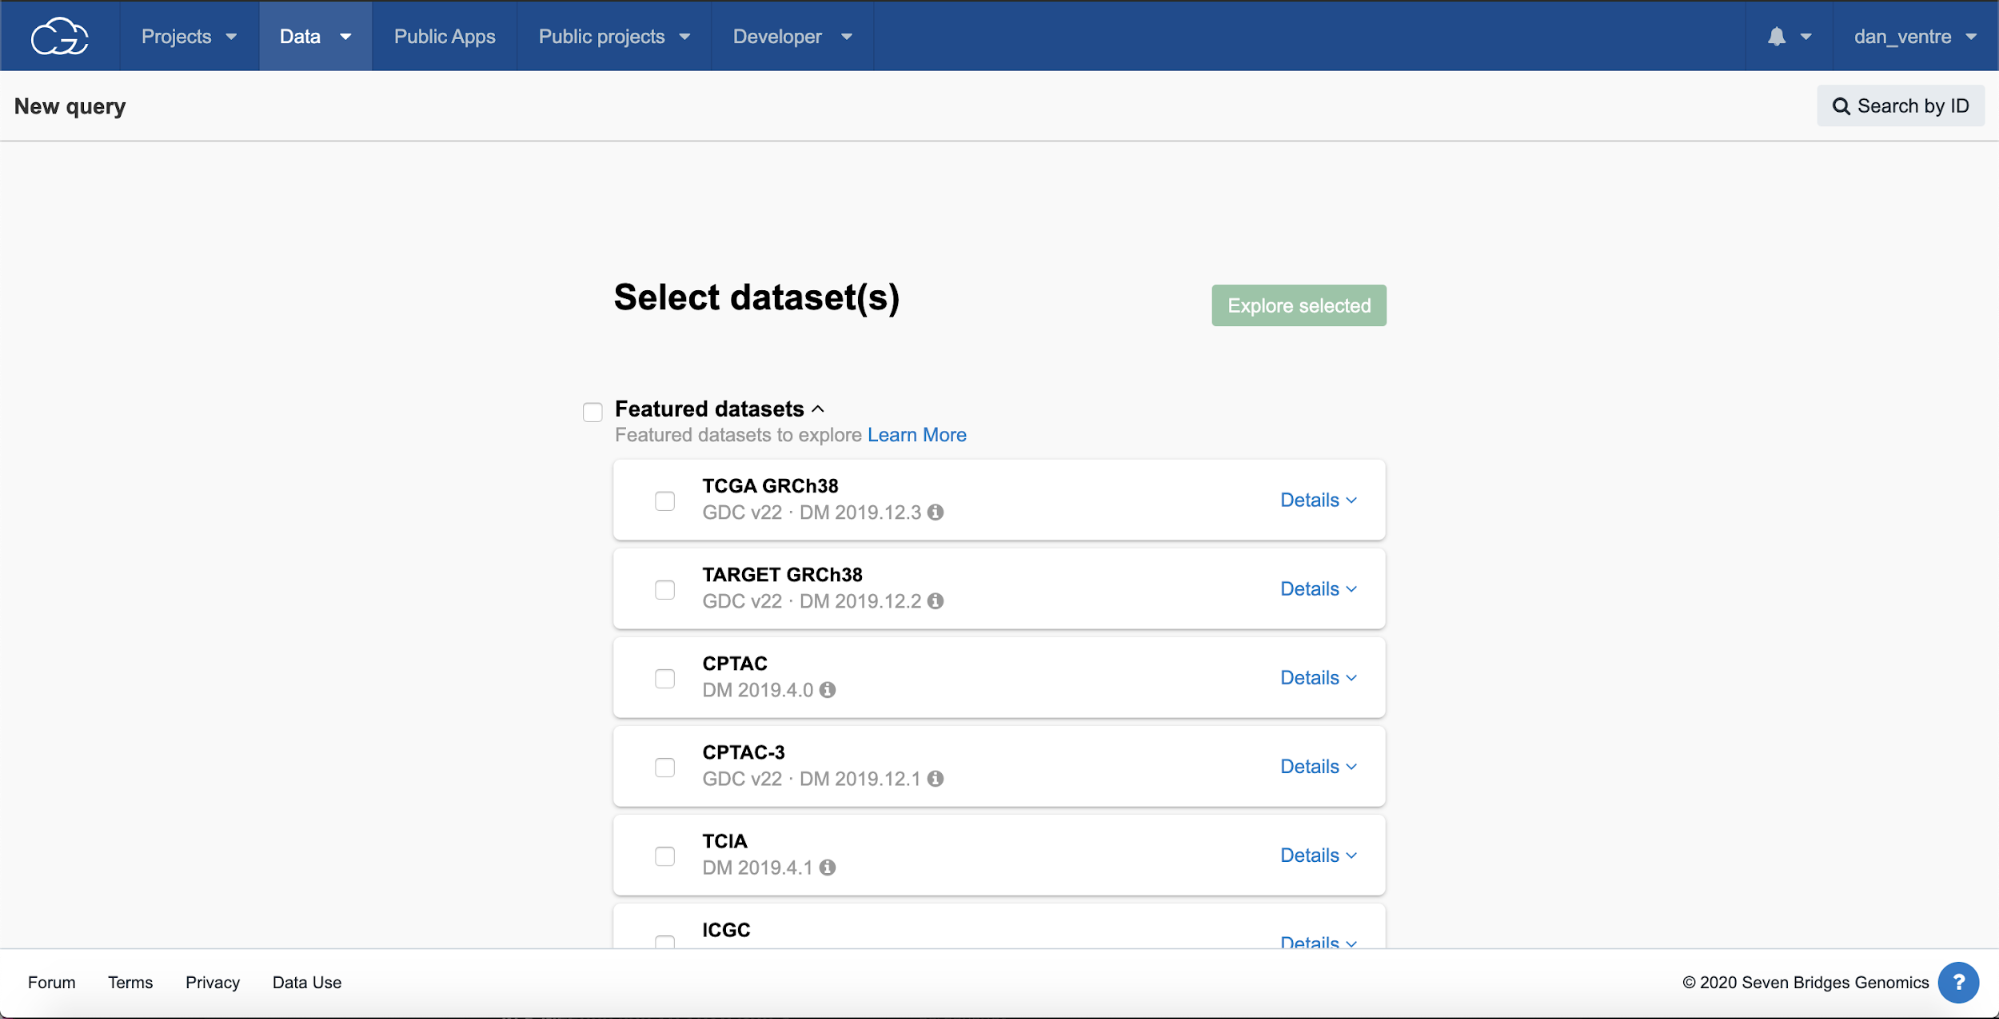
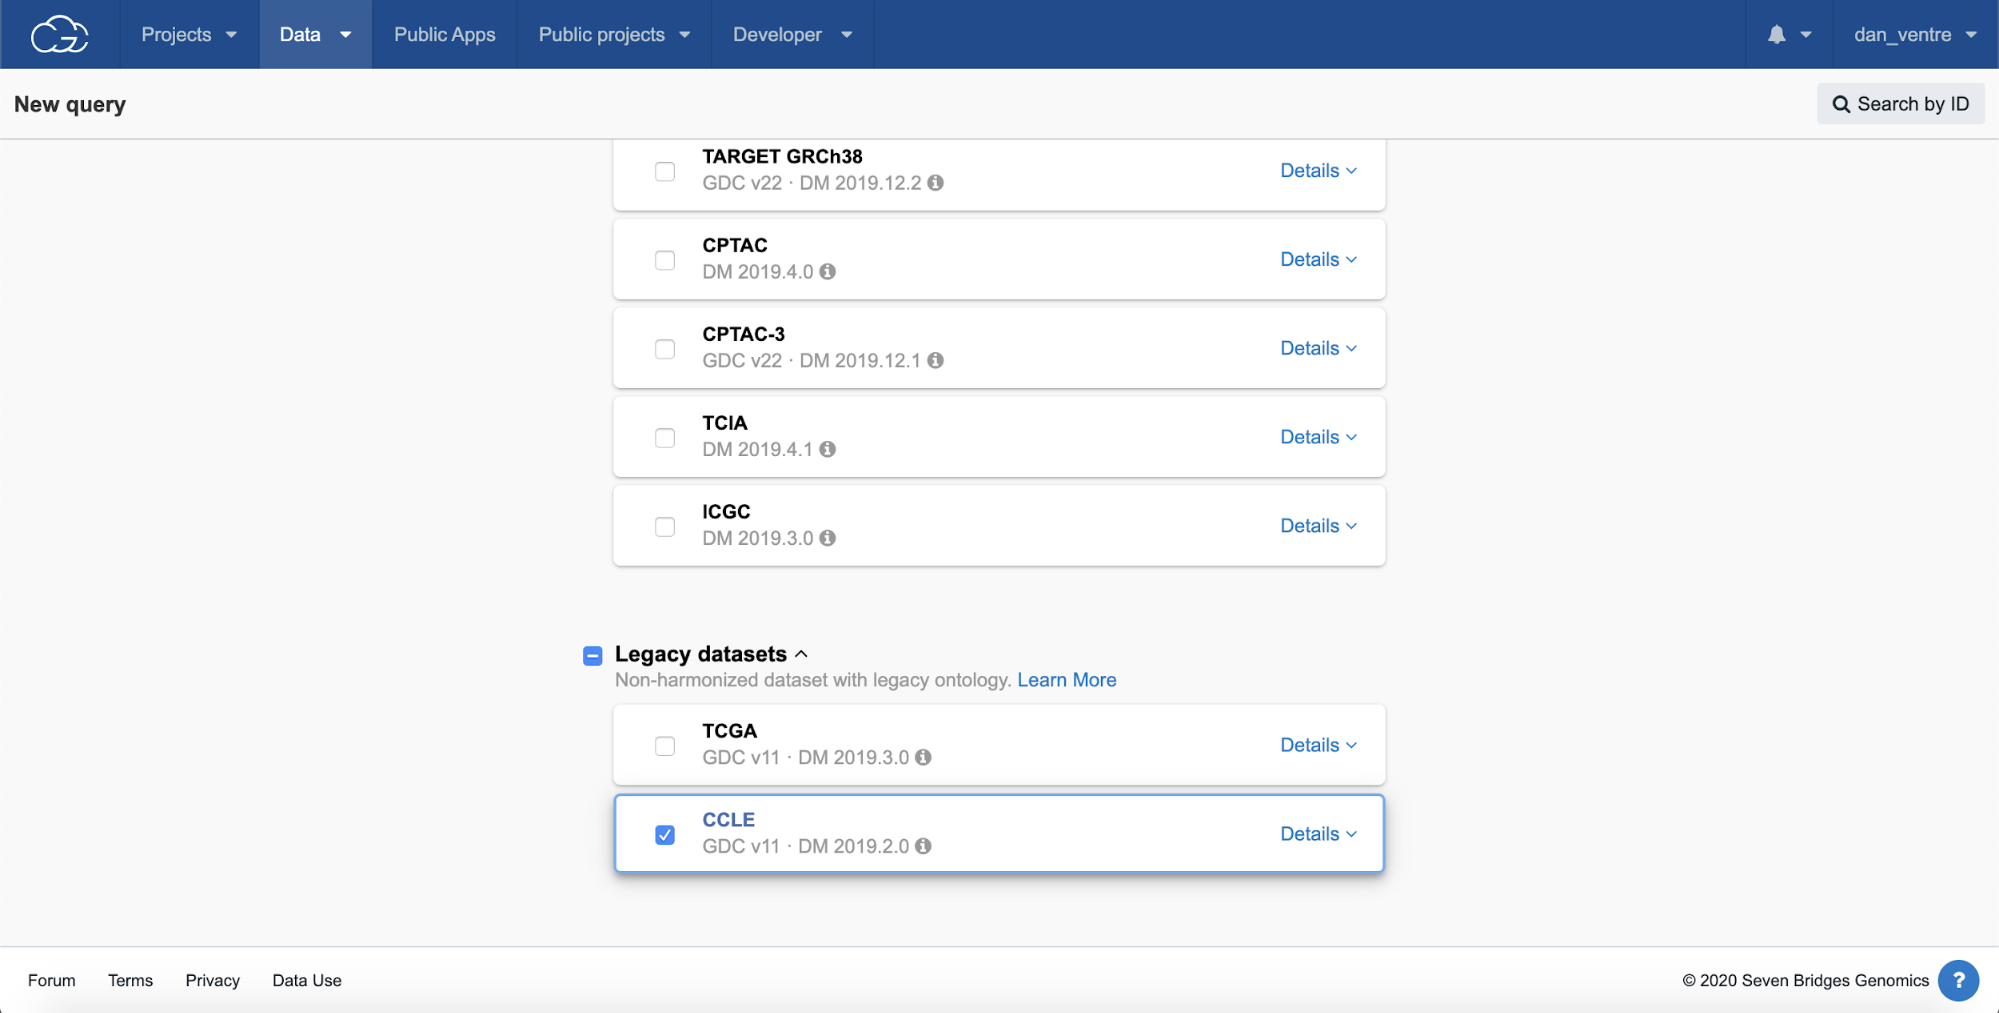
Step 2b. Scroll down to “Legacy datasets” and check the box under “CCLE,” then scroll up to the top of the page and click the green “Explore selected” button.
Step 2b: CCLE Selection
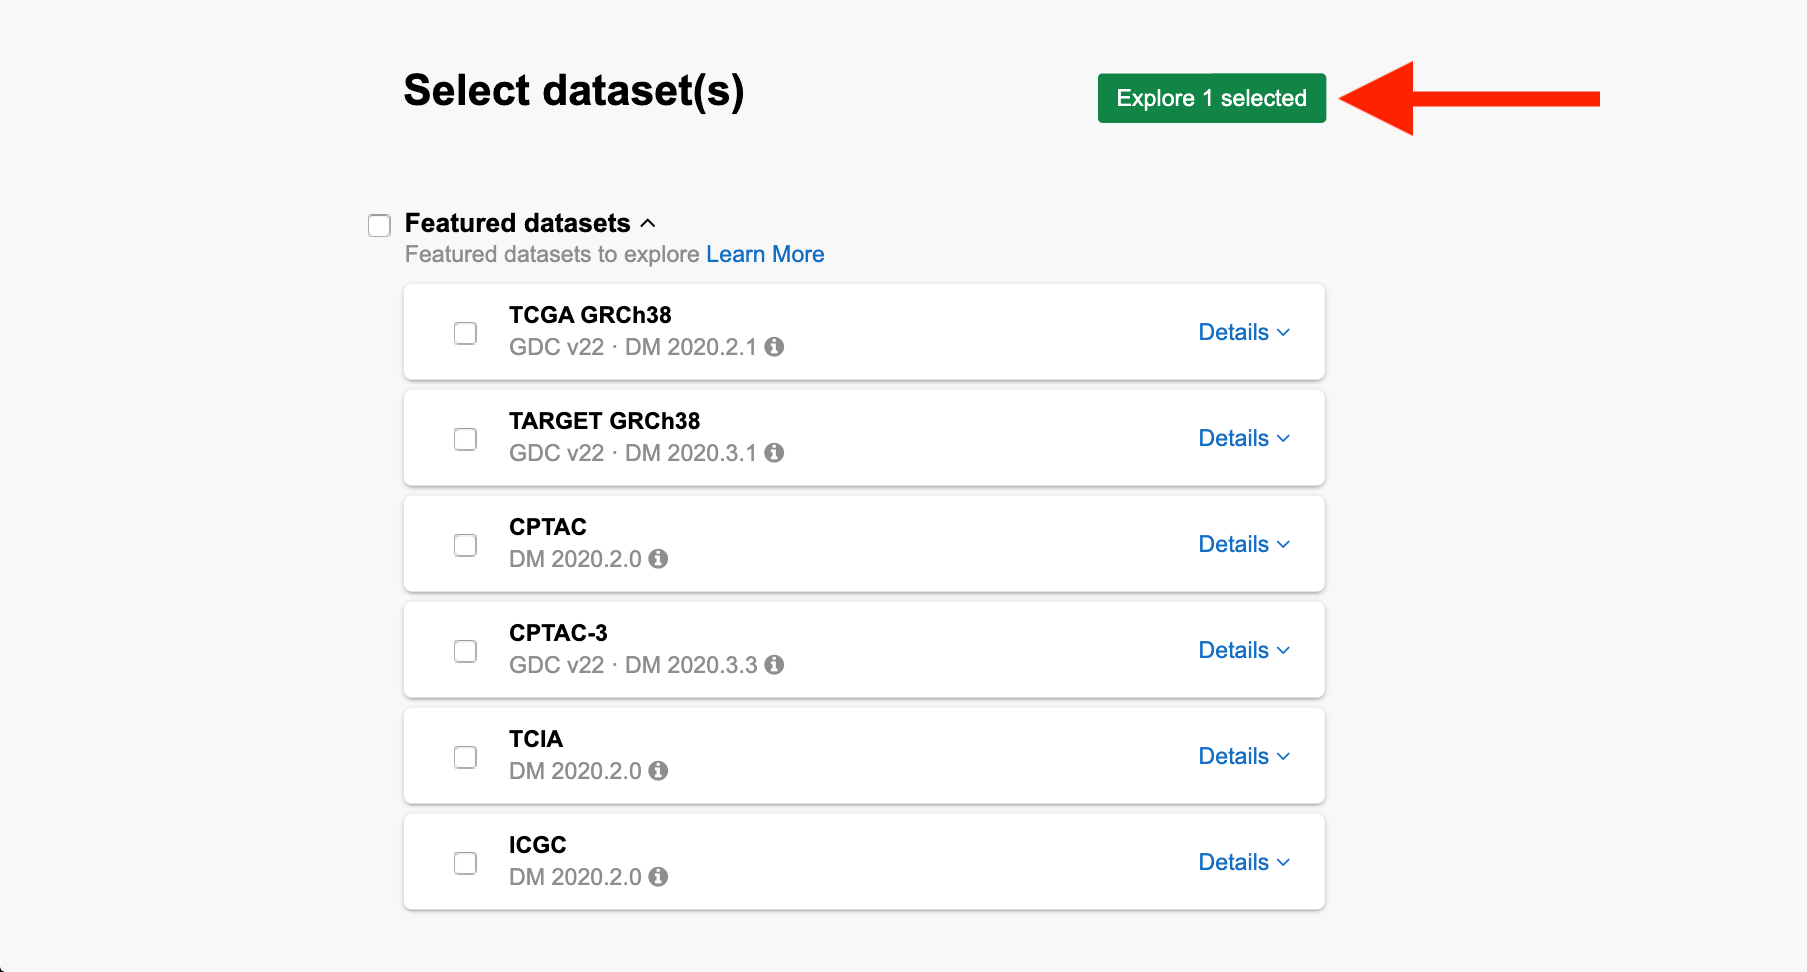
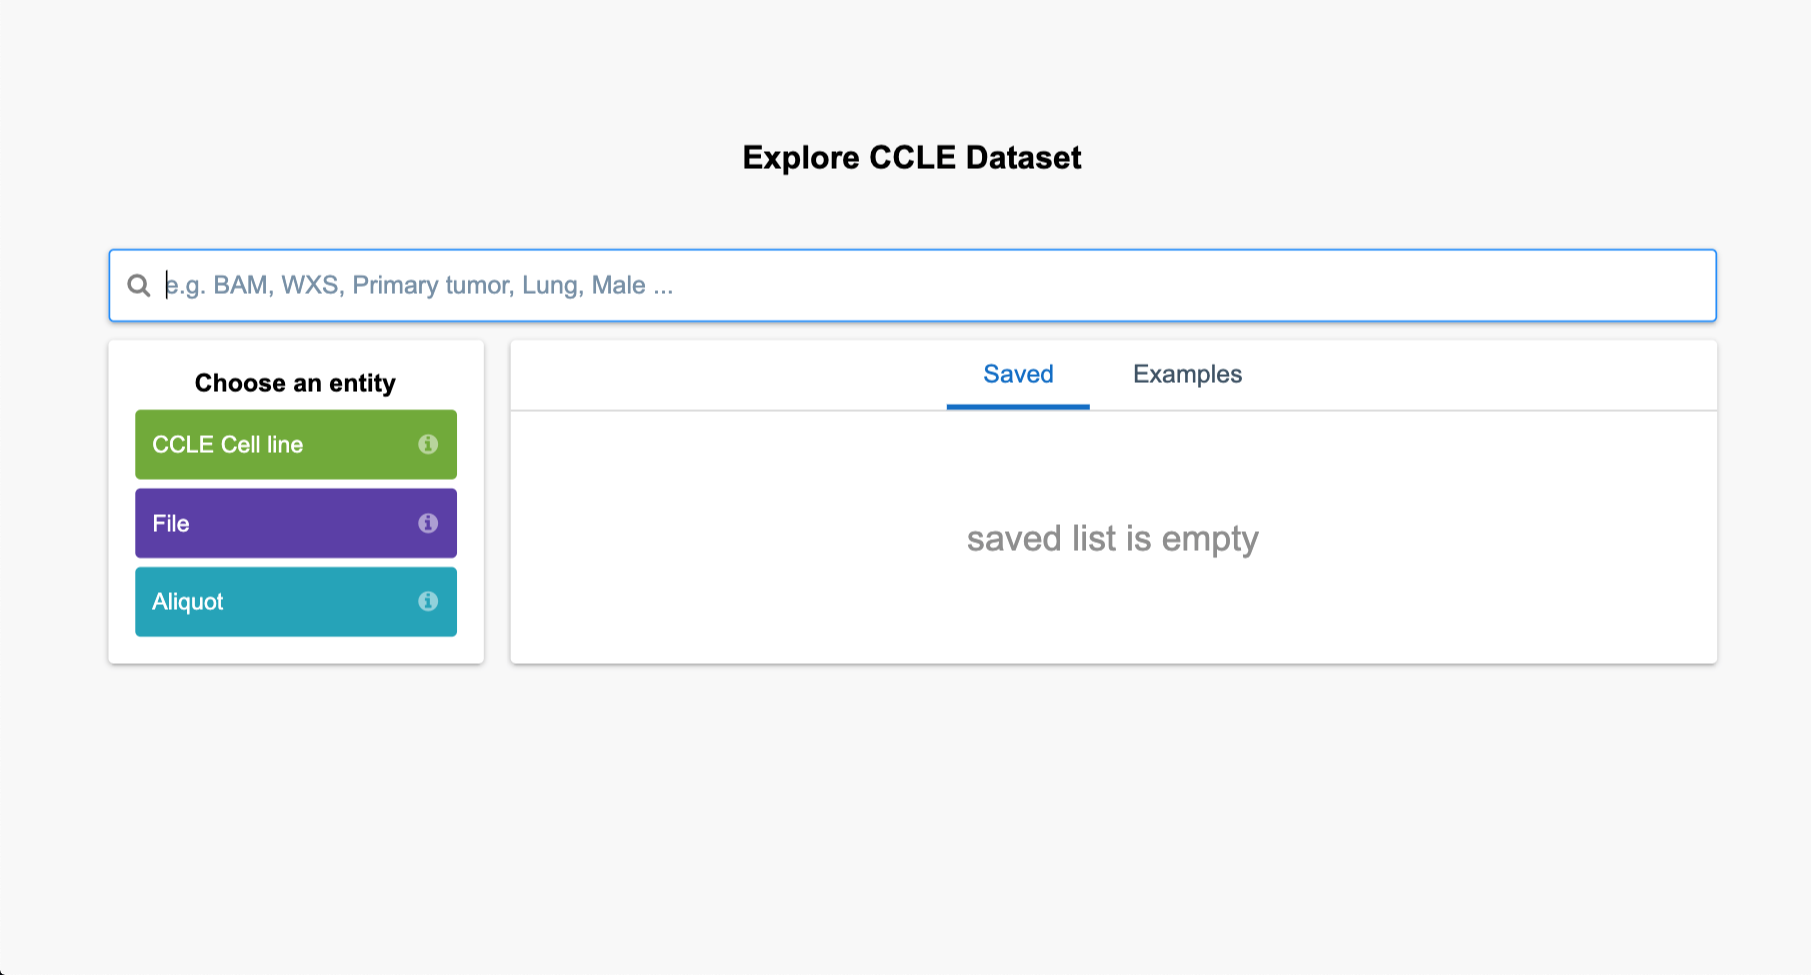
From the query page, you can see the list of active datasets on the left-hand side.
Step 2c. Click on the green “CCLE Cell line” box to expand the filtering options. Additional levels of filtering options, such as those under the “File” box will appear.
Step 2c: Filtering by File
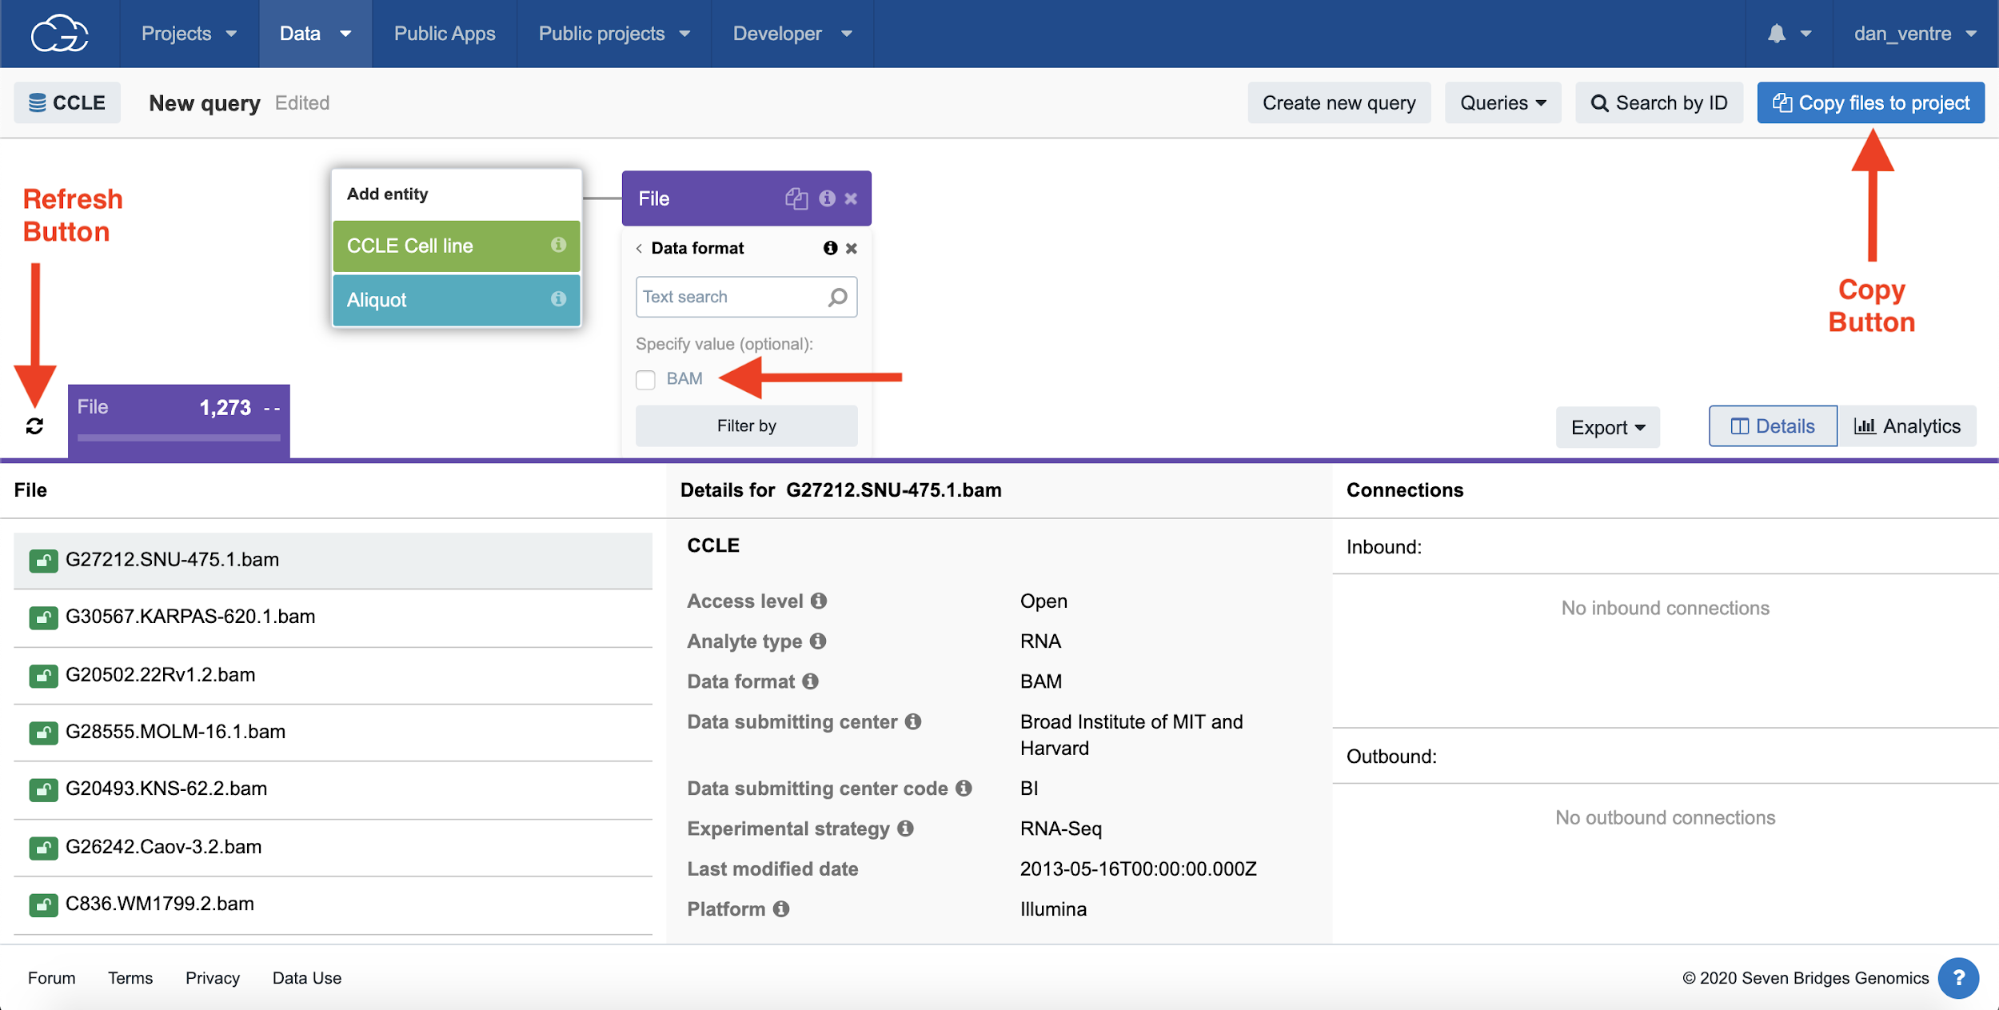
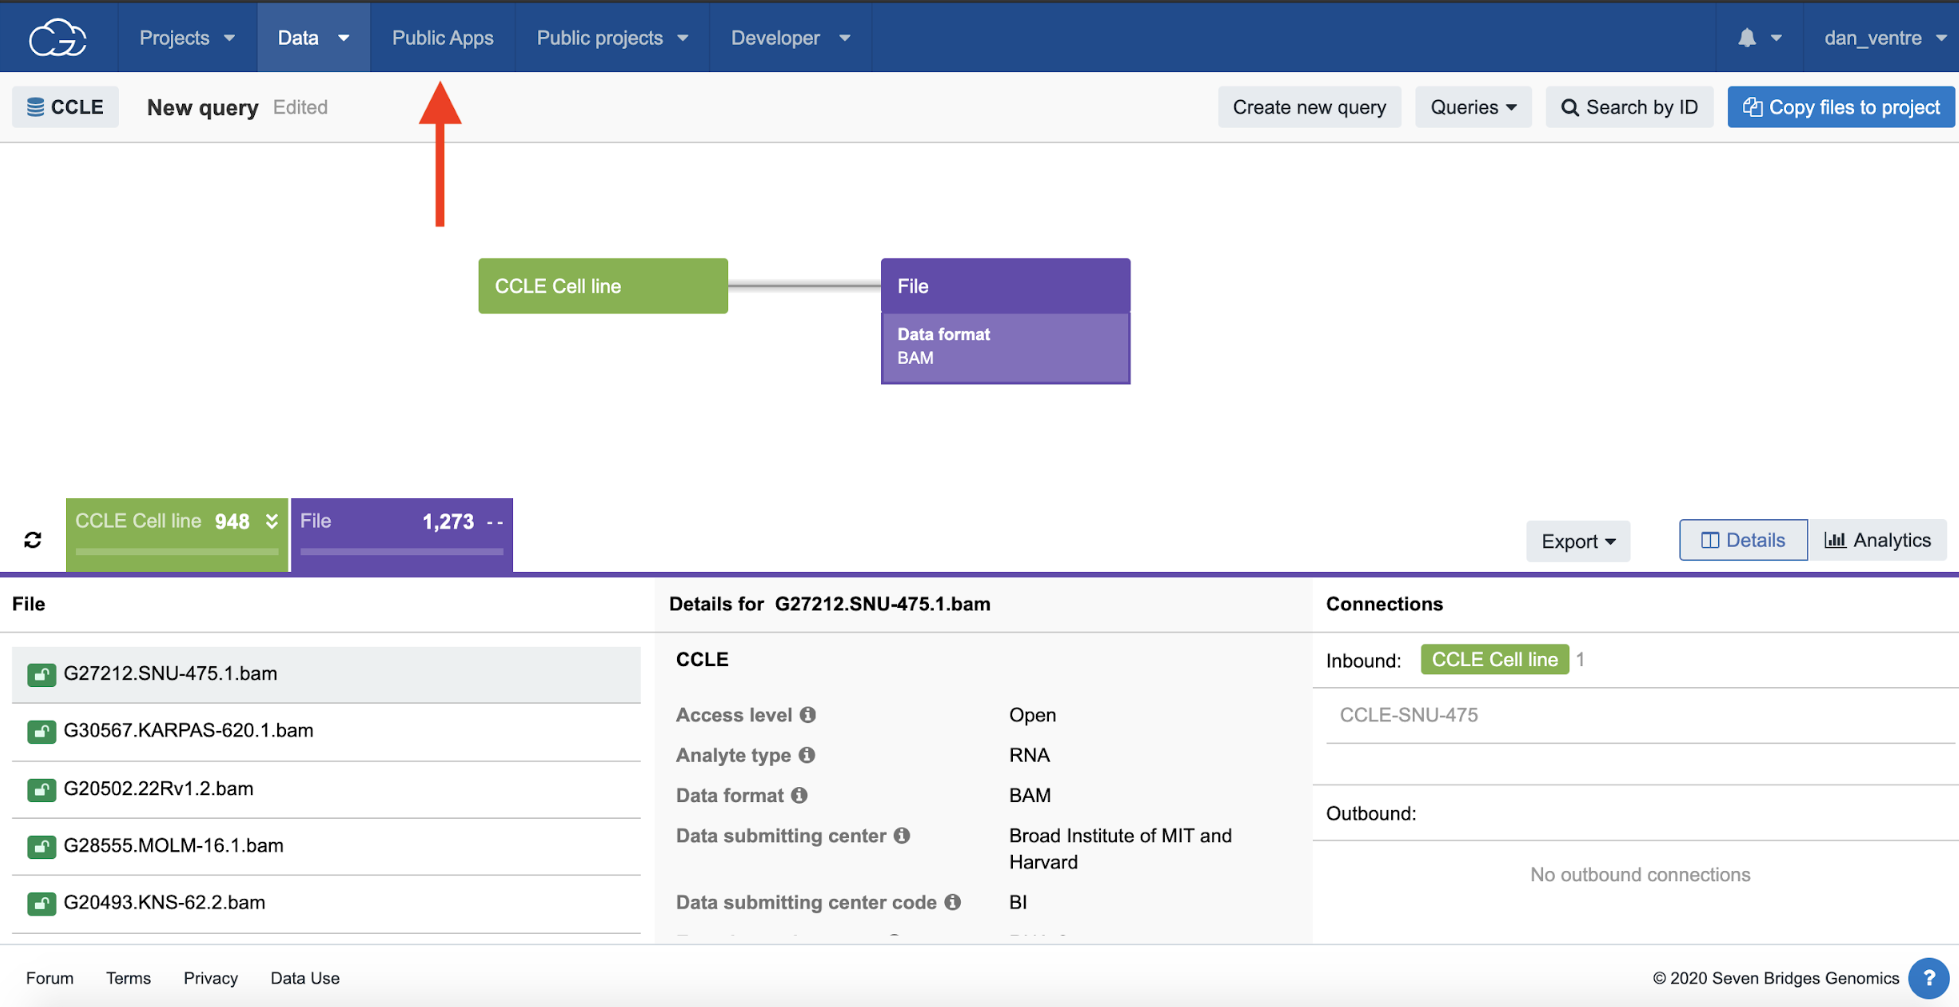
Step 2d. Click on the purple “File” tab to open these filtering options, then click “Data format,” and then check the “BAM” box and then the “Filter by” box beneath it.
Step 2e.Next, click the refresh button.
The file names identified are listed in the bottom part of the page.
Step 2f. To bring these files to a project for analysis, select “Copy files to project.” Select your “Example Project” from the list of projects, and a new popup box will appear. Then, click “Copy selected files.”
Step 2d-f: Data Browser Filters, File Selection, and Refresh
Step 2f: Copy Files to Project
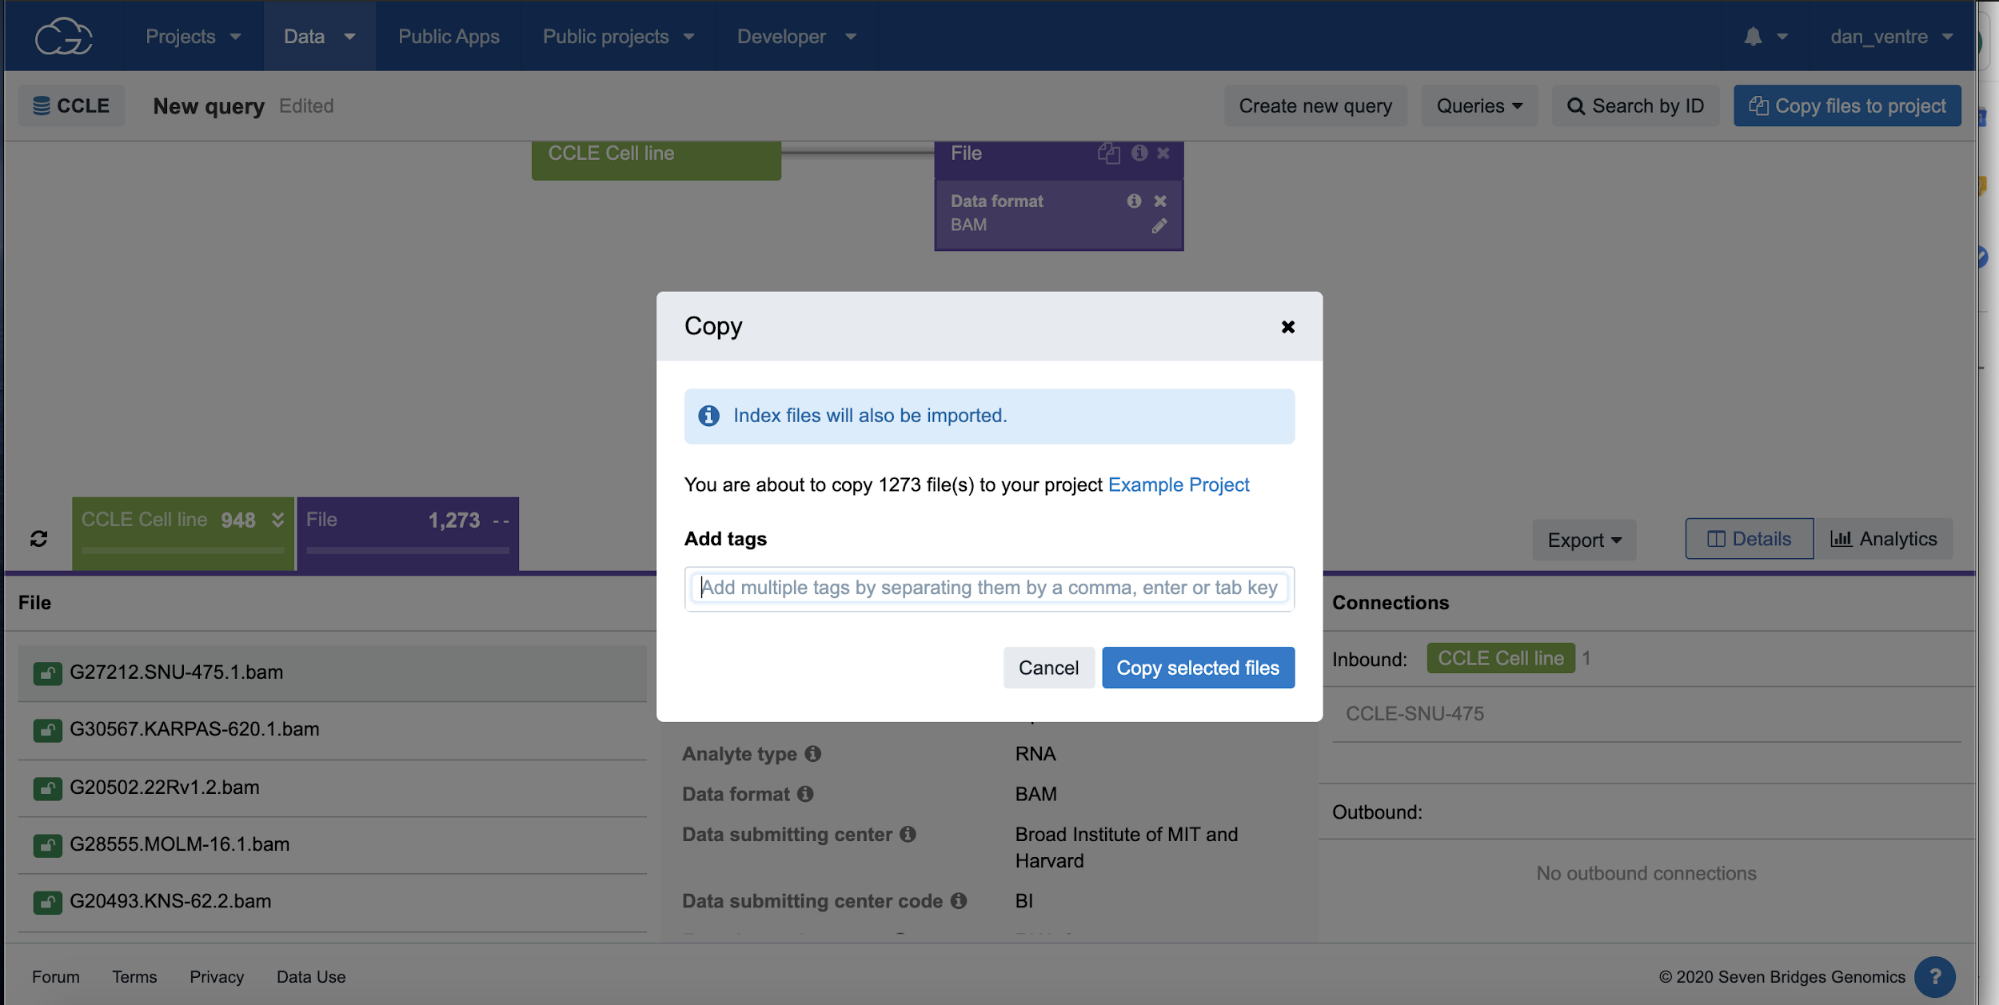
A green banner at the top center of the screen to confirm that the files were successfully copied.
Step 3: Adding apps
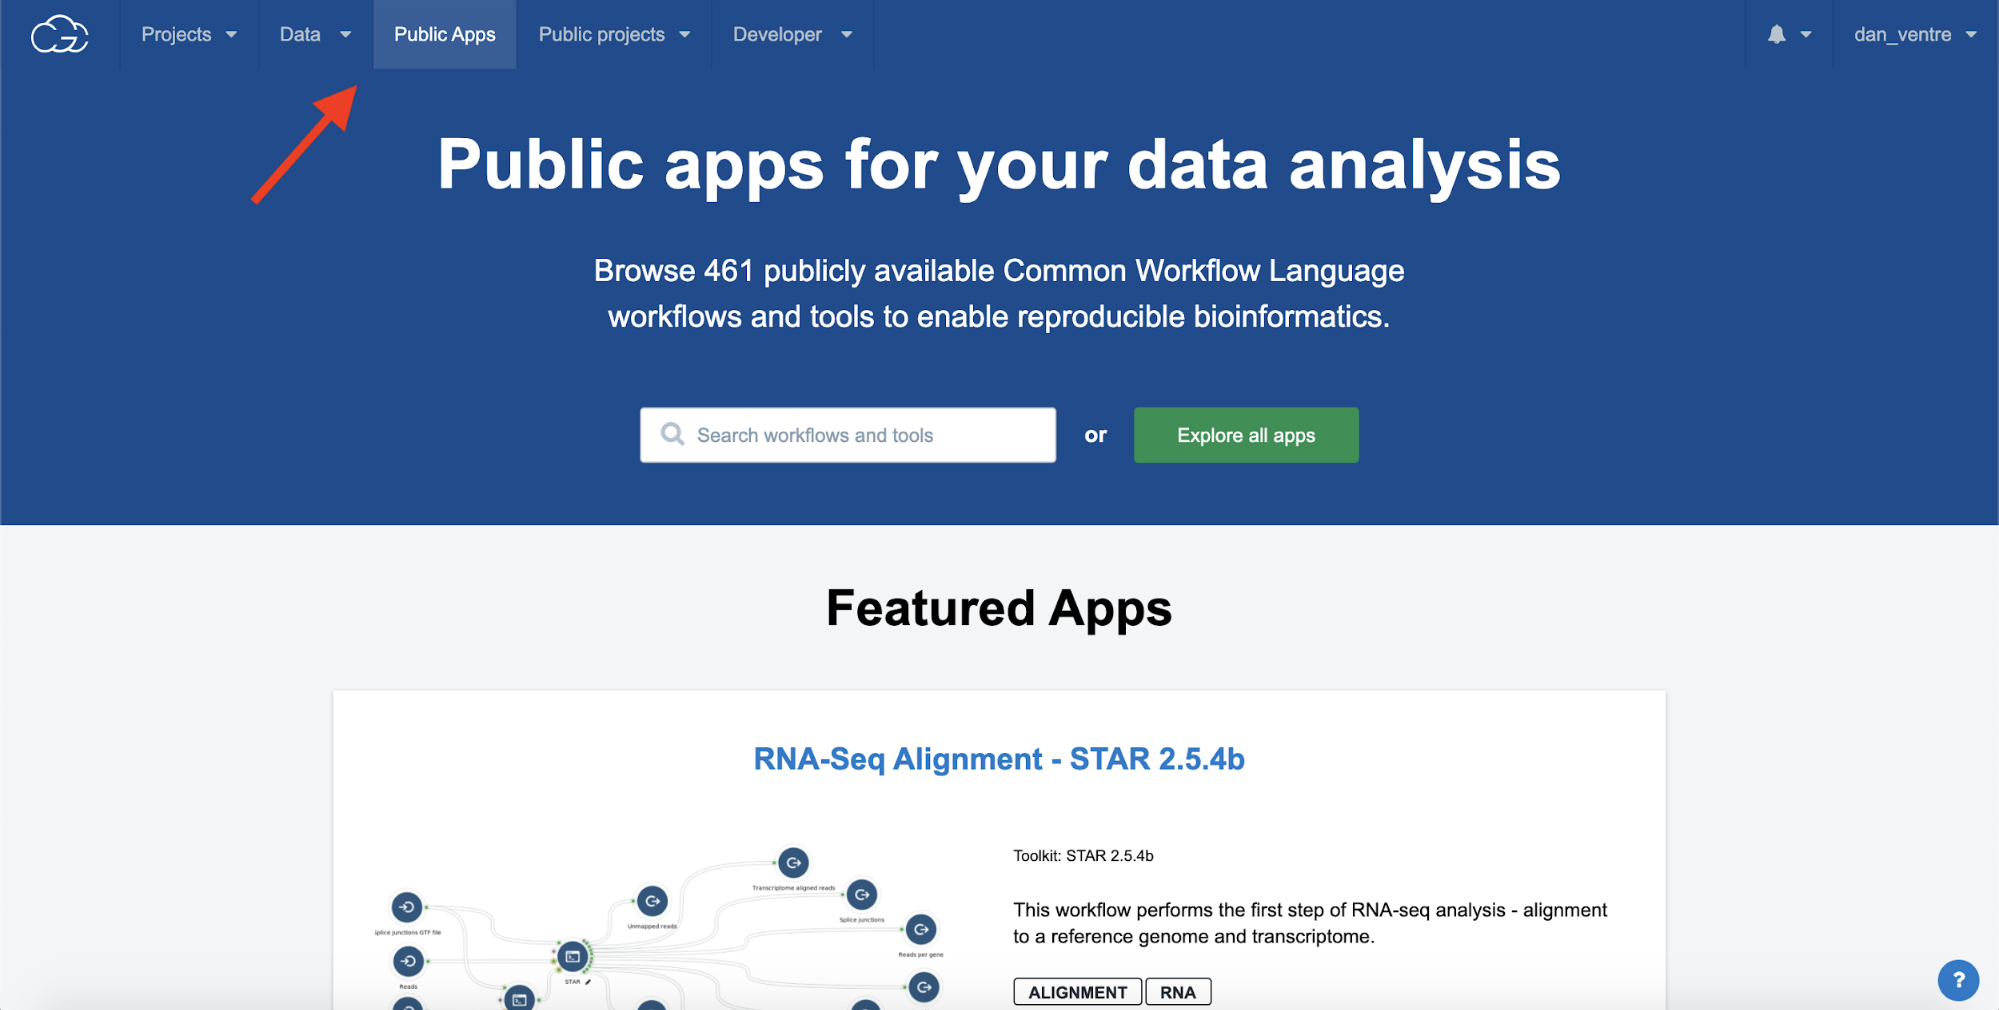
In the Public Apps gallery, we have hundreds of cloud-optimized tools and workflows for many types of analyses. All tools and workflows are in the Common Workflow Language (CWL), which is both human and machine-readable and has all the necessary information to run the tool in a reproducible way. You also have the option to bring your own tools and workflows to the platform using Docker and our SDK.
Step 3a. After adding Files to the project, click the “Public Apps” tab at the top of the screen to go to the Public Apps gallery.
Step 3a. Navigating to Public Apps Dashboard
The Public Apps Dashboard
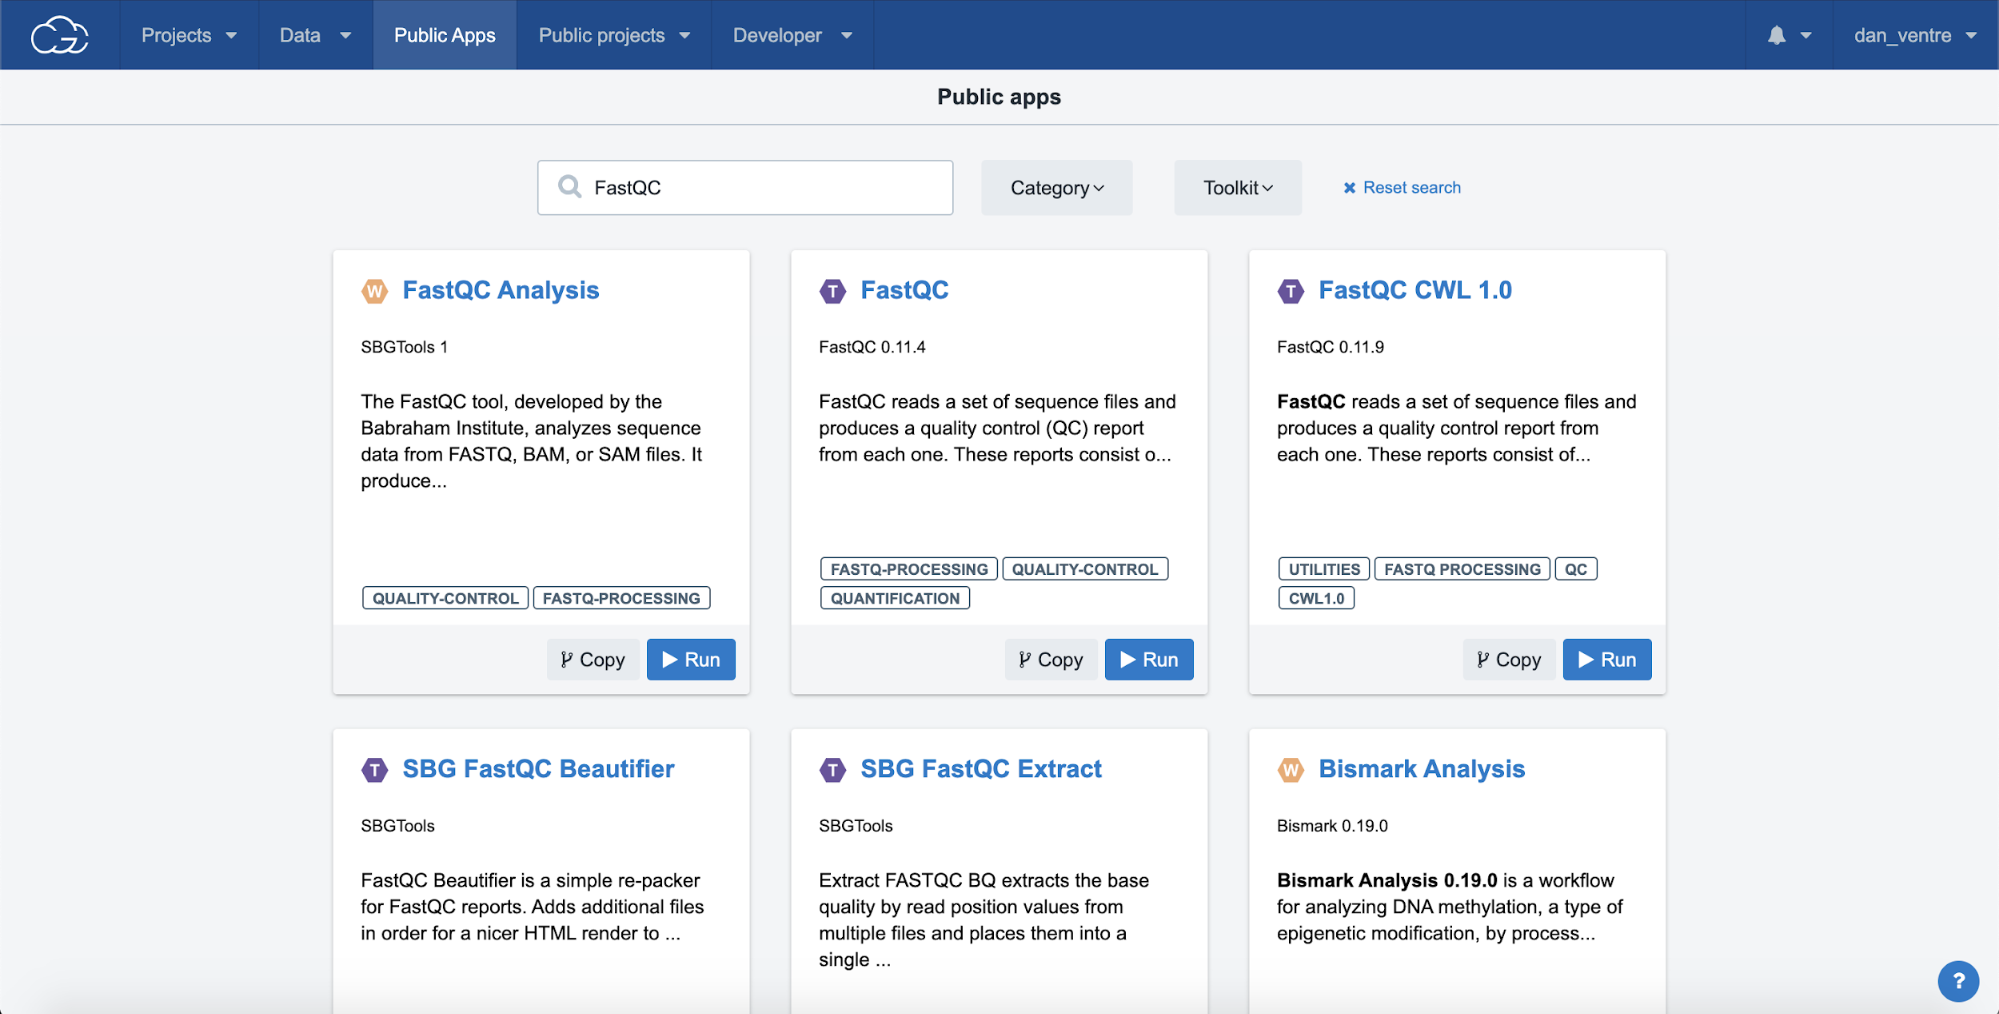
In this tutorial, we will be using the FastQC workflow.
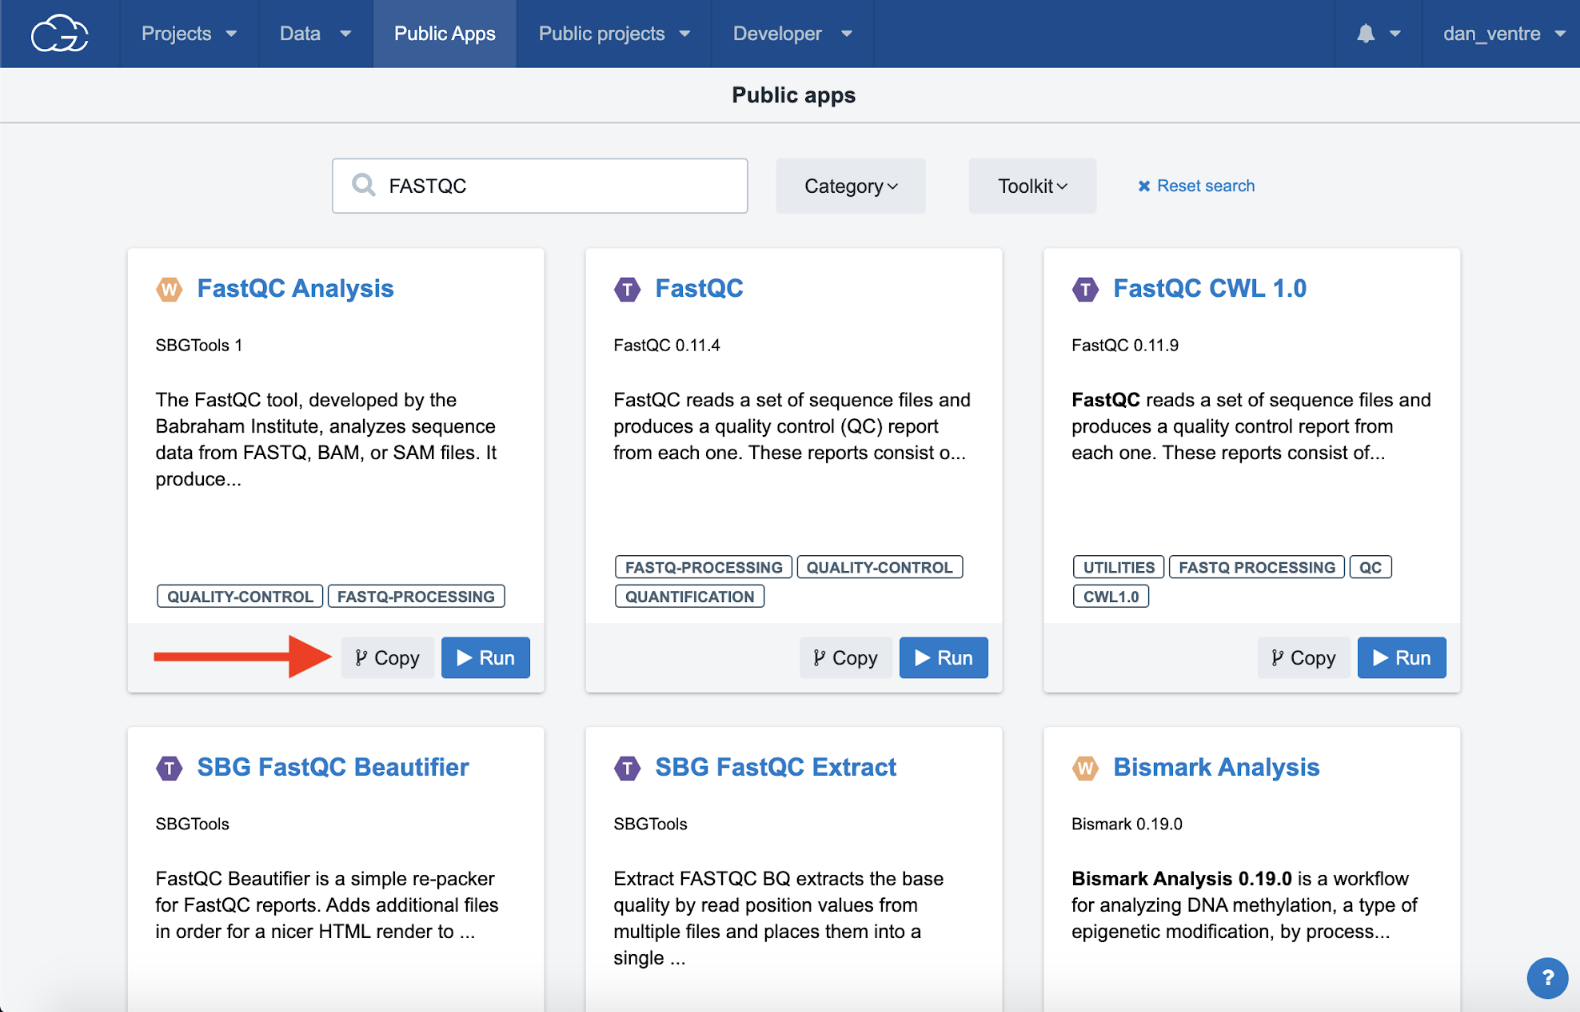
Step 3b. Type “FastQC” into the search bar at the top of the screen and hit enter to search the entire gallery. You will see options for both individual tools and entire workflows using the FastQC tool.
Step 3b: FastQC Search Result
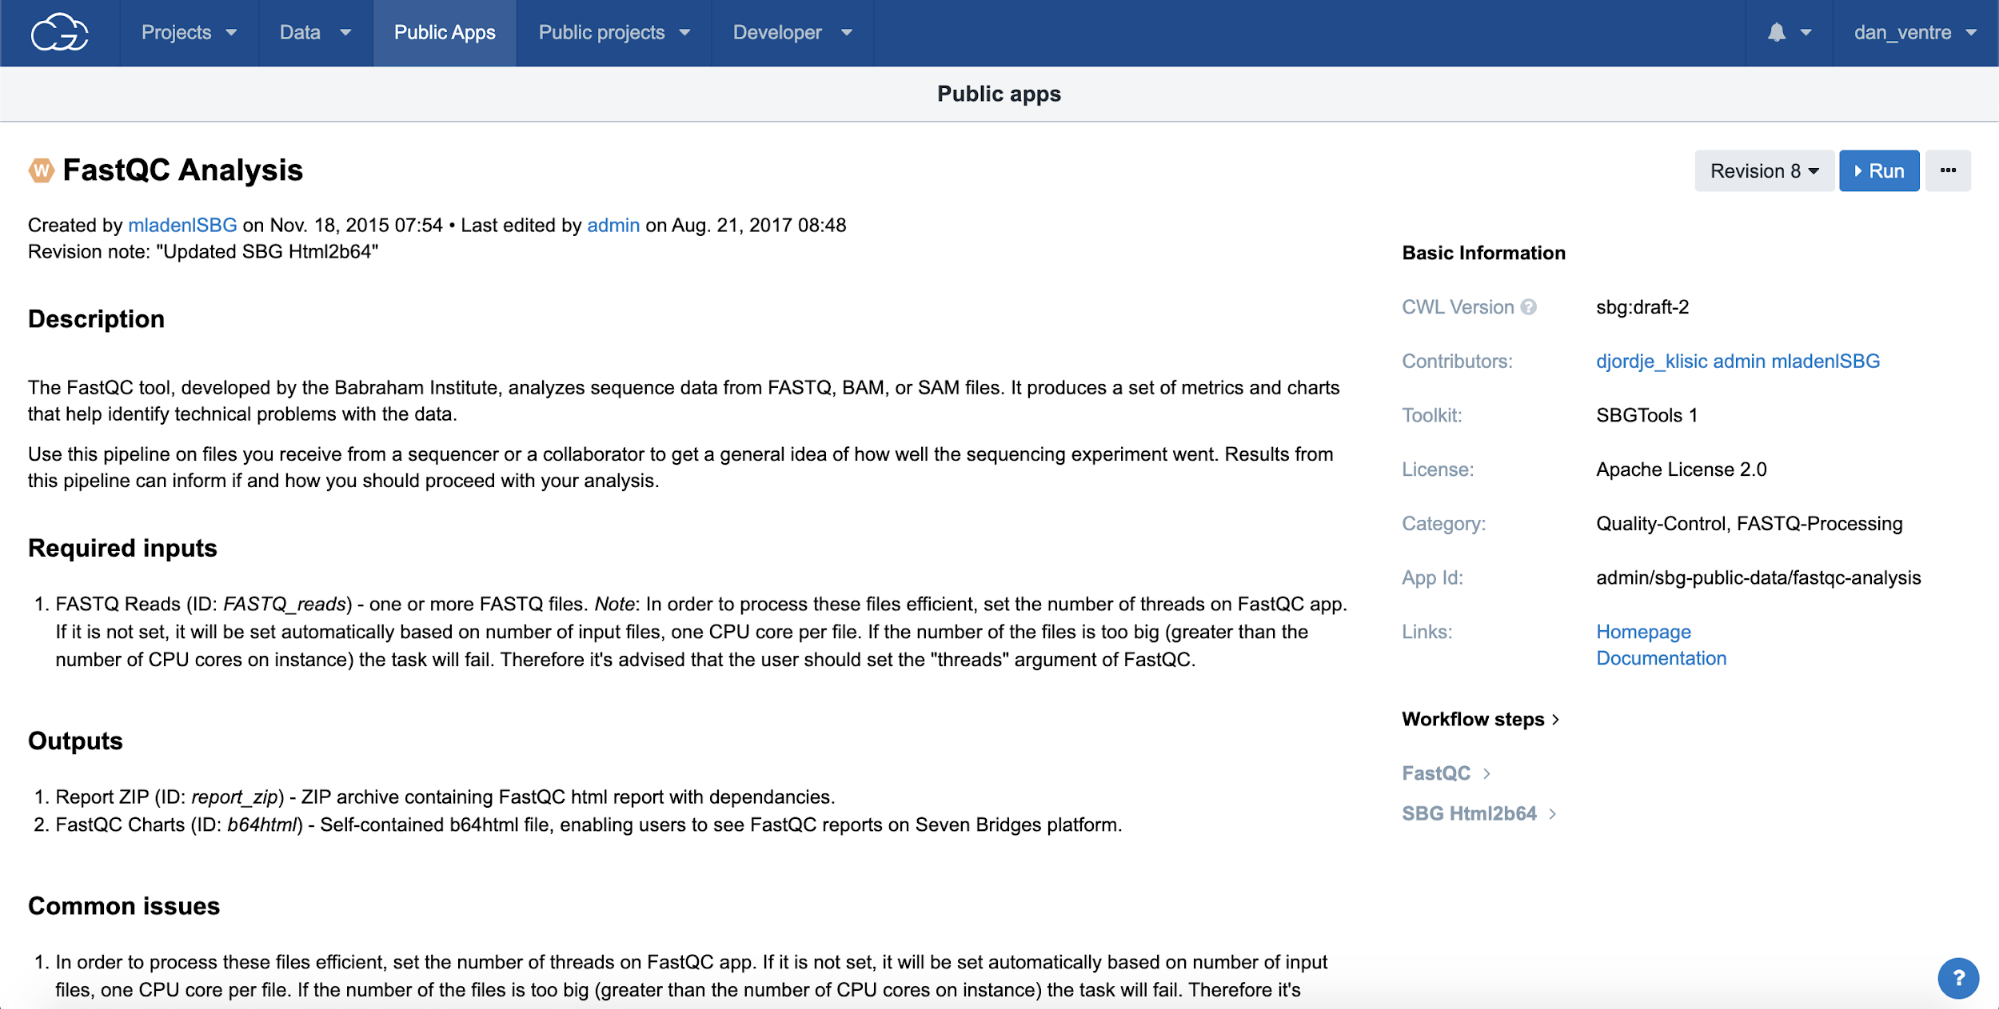
Please note that for each of the hosted tools and workflows in the Public Apps, you can see a description of the tool/workflows along with helpful information like the required inputs, outputs, and common issues.
Step 3c. To get to the Description Page, click on the app title, in this case: “FastQC Analysis” (the blue title text). To return to the FASTQC search results after reading the description, press the back button on your browser.
Step 3c: FastQC Description Page
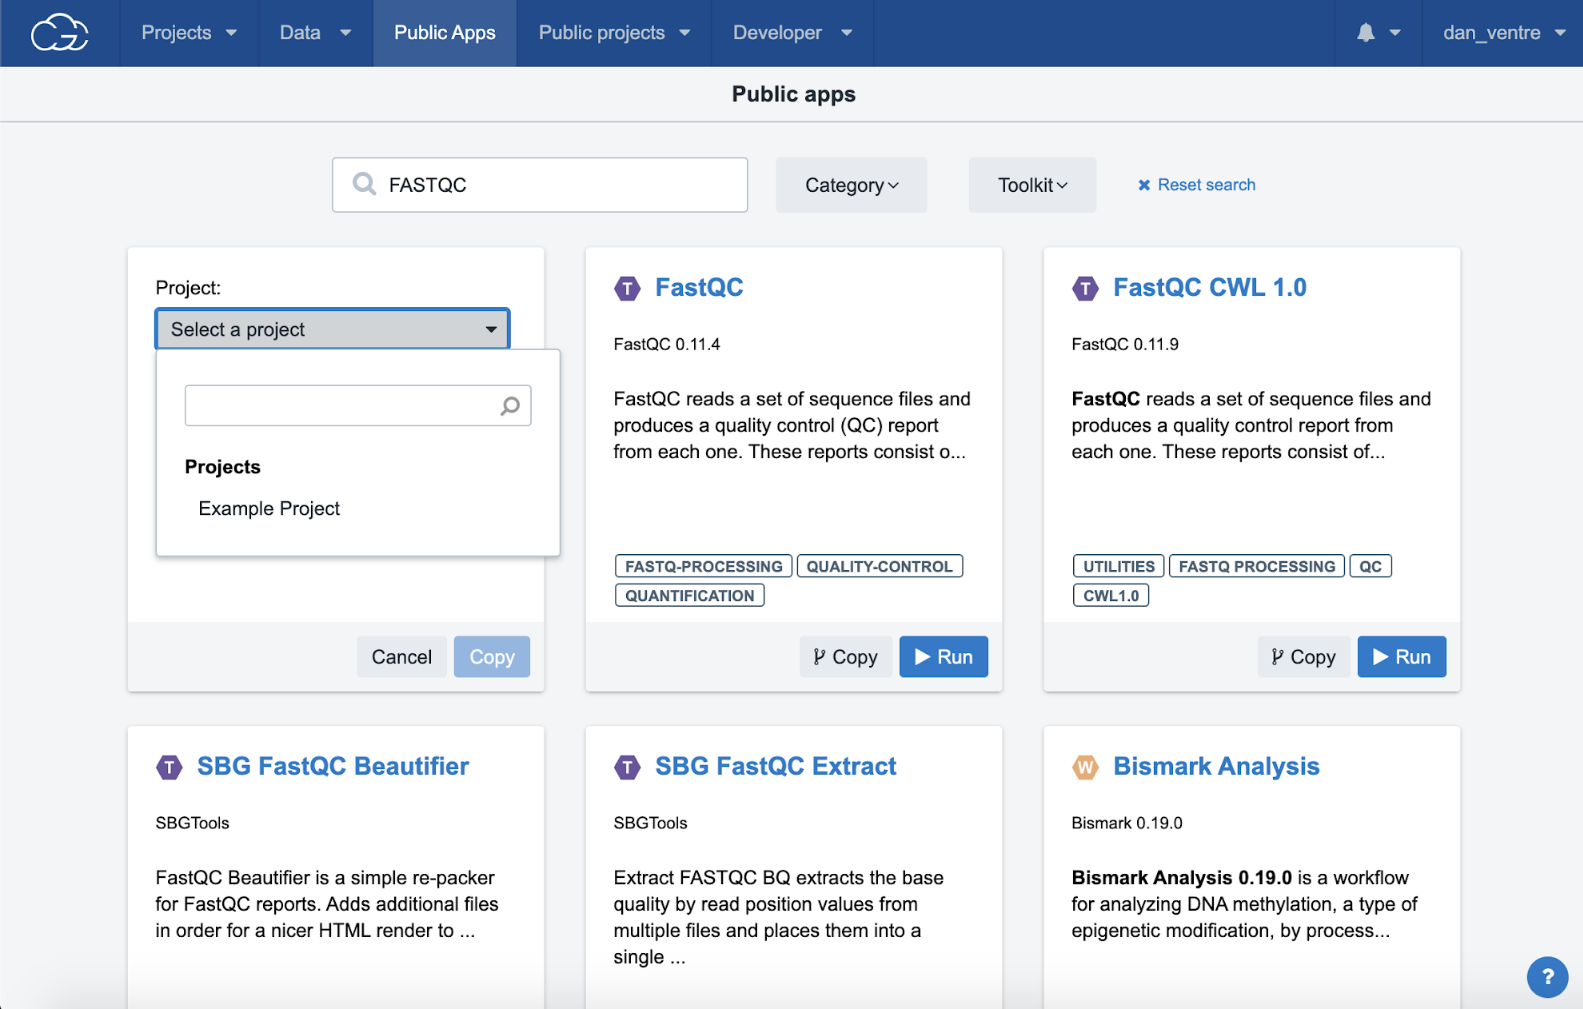
Step 3d. Select the workflow (W) called “FastQC Analysis” by clicking the “Copy” button. This will bring up an option to select which project you’d like to copy the workflow to.
Step 3d: Copying the App to your project
Step 3e. Select your “Example Project” from the dropdown menu and click the “Copy” button. A green banner at the top of the screen will confirm the app was successfully copied.
Step 3e: Copying app to project
Step 4: Run your analysis
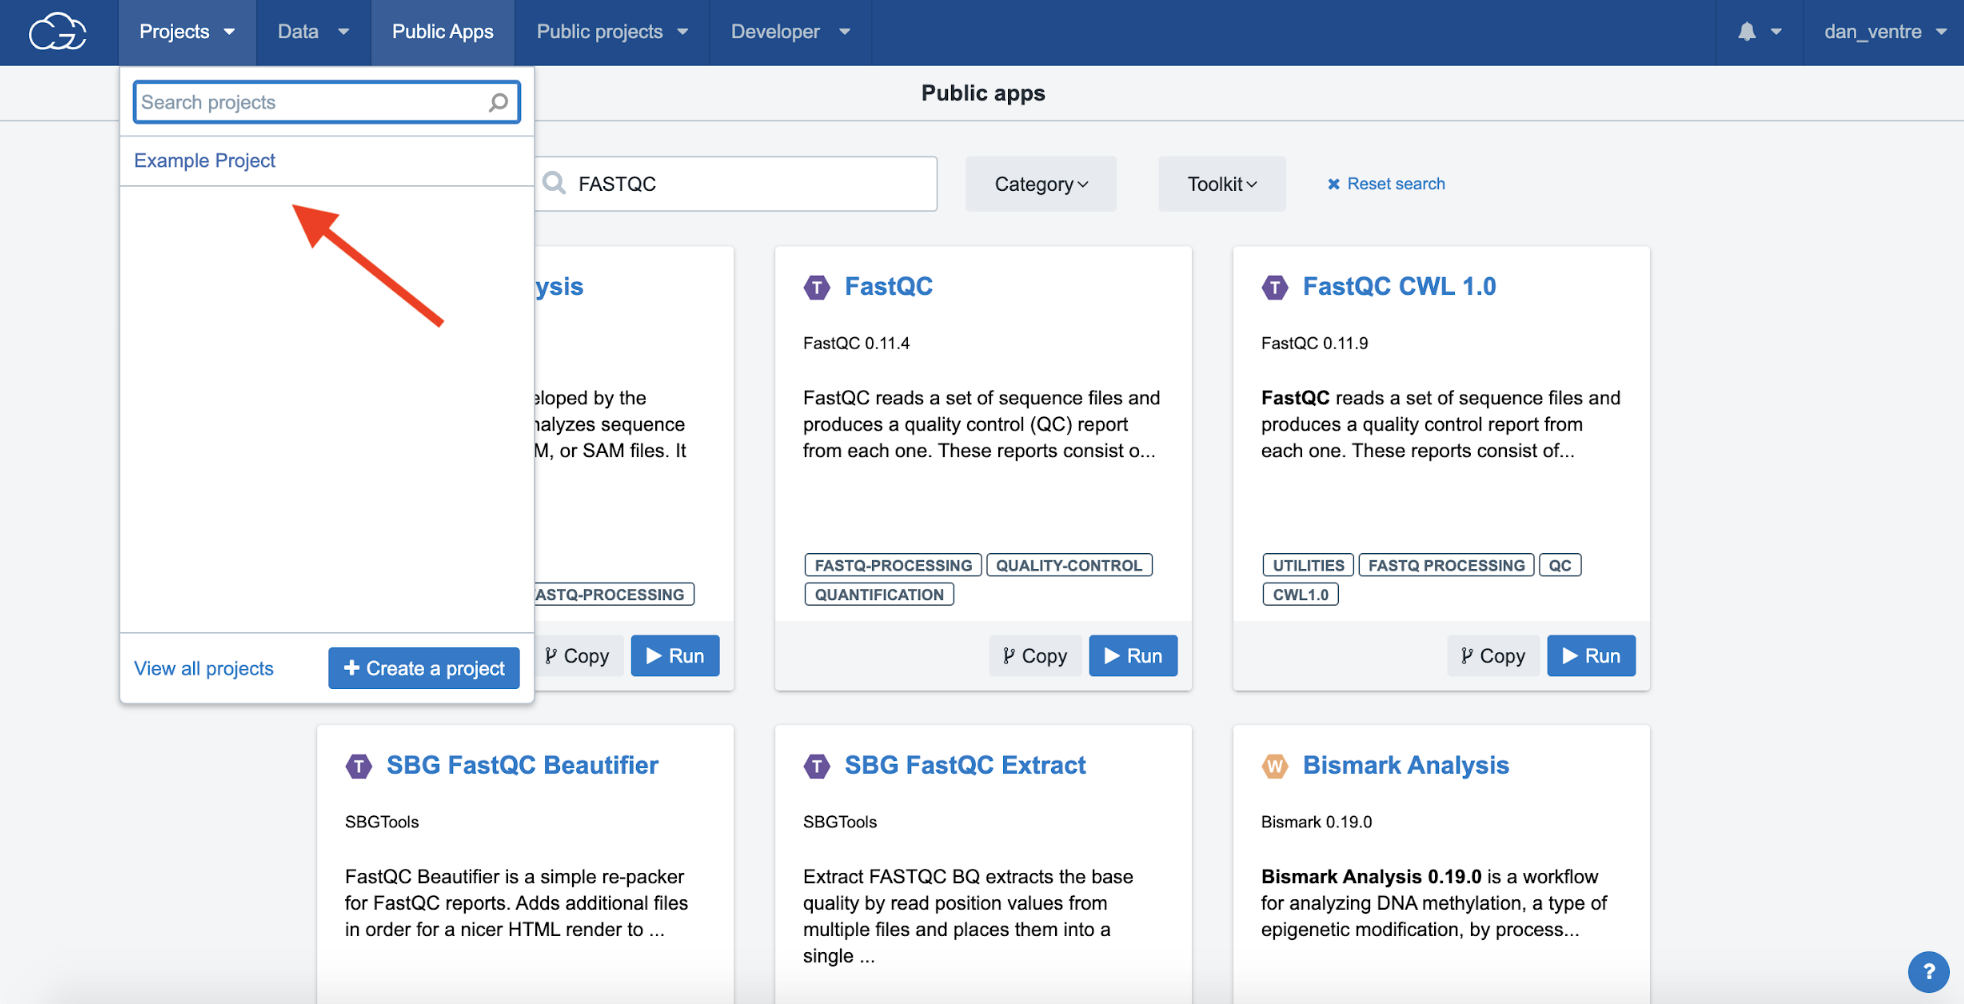
Step 4a. To continue, click the “Projects” tab at the top left-hand side of the screen (shown in the screenshot below by the leftmost red arrow), and click “Example Project” from the dropdown menu. This will return to the Project Dashboard.
Step 4a: Returning to the Project Dashboard
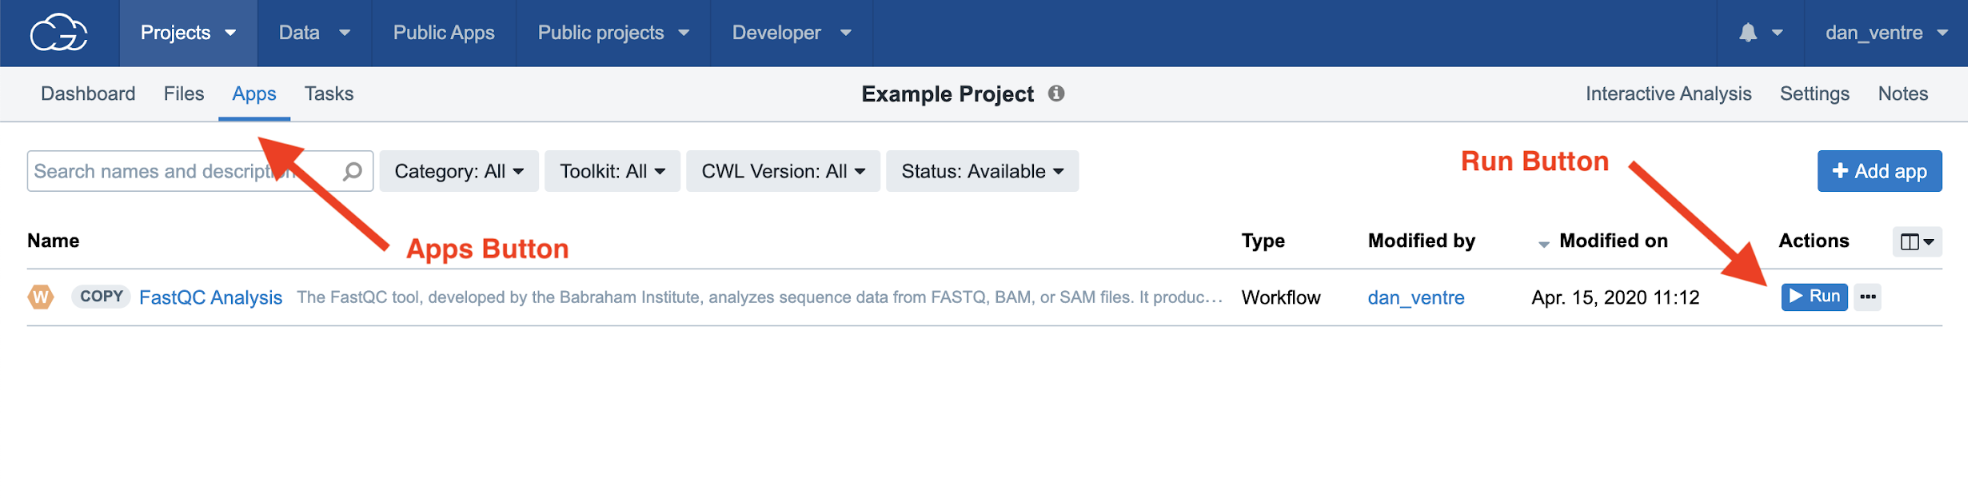
Step 4b. To run an analysis on the CGC, you must set up specific Tasks. To set up your Task: from the Project Dashboard, click “Apps.” Next, after moving to the Apps page, select “Run” on the right-hand side of the screen to create the Task.
Step 4b: Navigating to the Tasks via the Apps tab
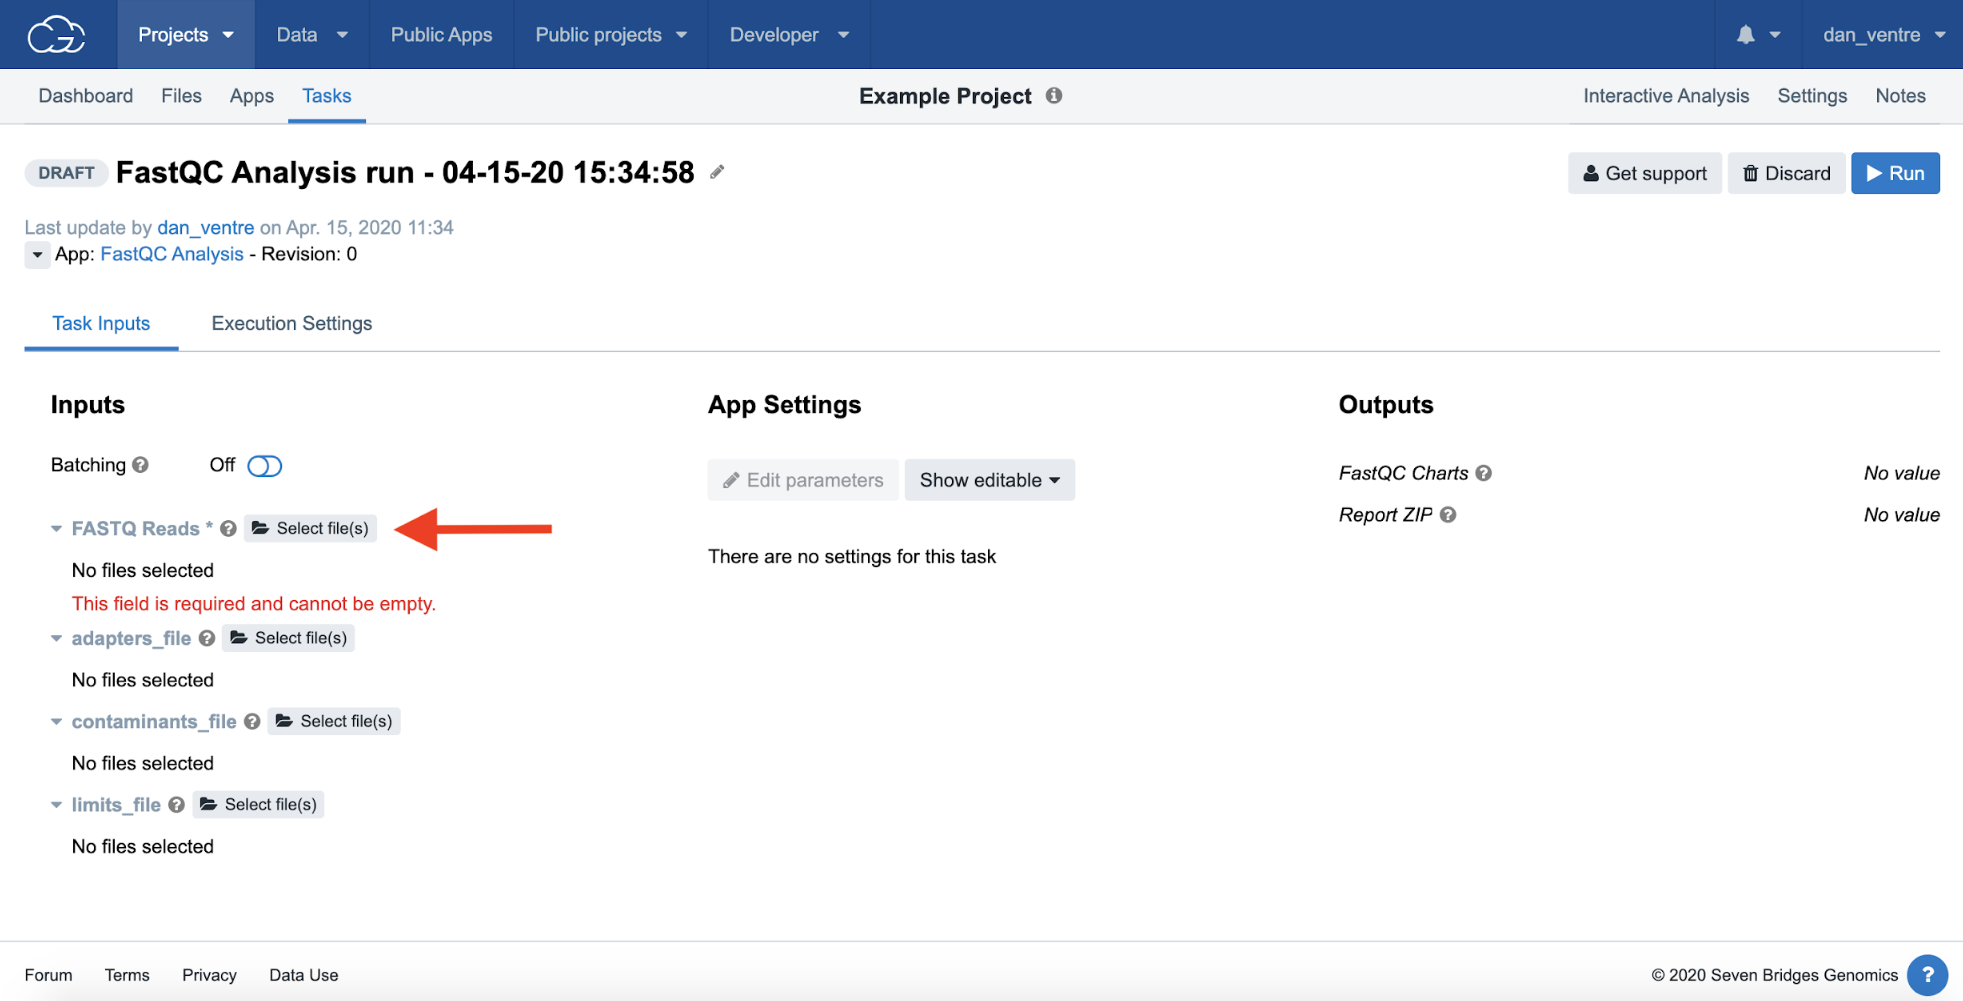
This will bring you the screen where you will select your input files and can adjust the app input settings. For this example, we can use the default settings and we will only have to select the files. When selecting input files for this run, only the BAM files are required.
Step 4c. To get to the input file selection screen, click the open folder icon to the right of “FASTQ Reads” under the “Inputs” header.
Step 4c: Input File Selection
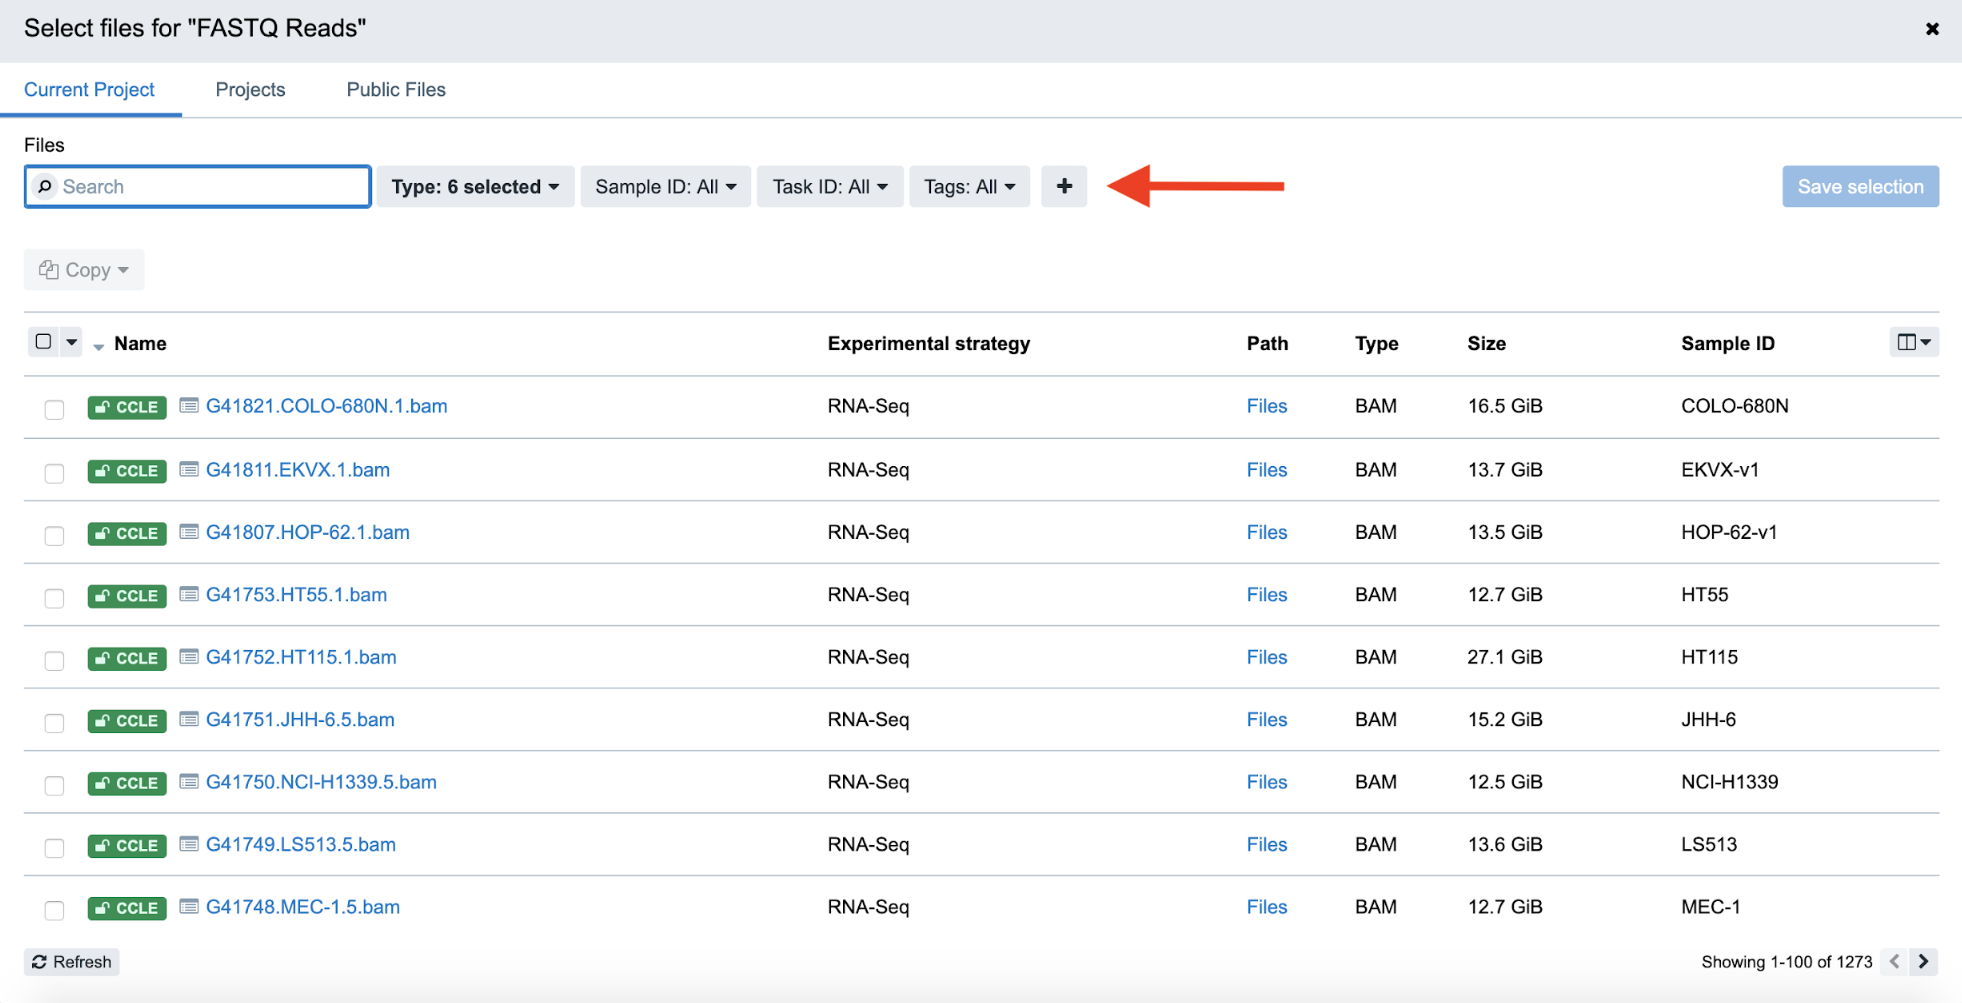
There are several BAM files in the CCLE dataset, and can further refine our list by elements such as Gender, Ethnicity, Case ID#, Sample type, and many others. In this example, we will filter by Case ID#. We recommend filtering here, as you will be running a huge amount of data at once without filtering this dataset.
Step 4d. On the file selection screen, click the “+” symbol on the toolbar to the right of the search box. Here, a dropdown menu aptly titled “Add/remove filters” allows you to do just that.
Step 4d: Adding a Filter
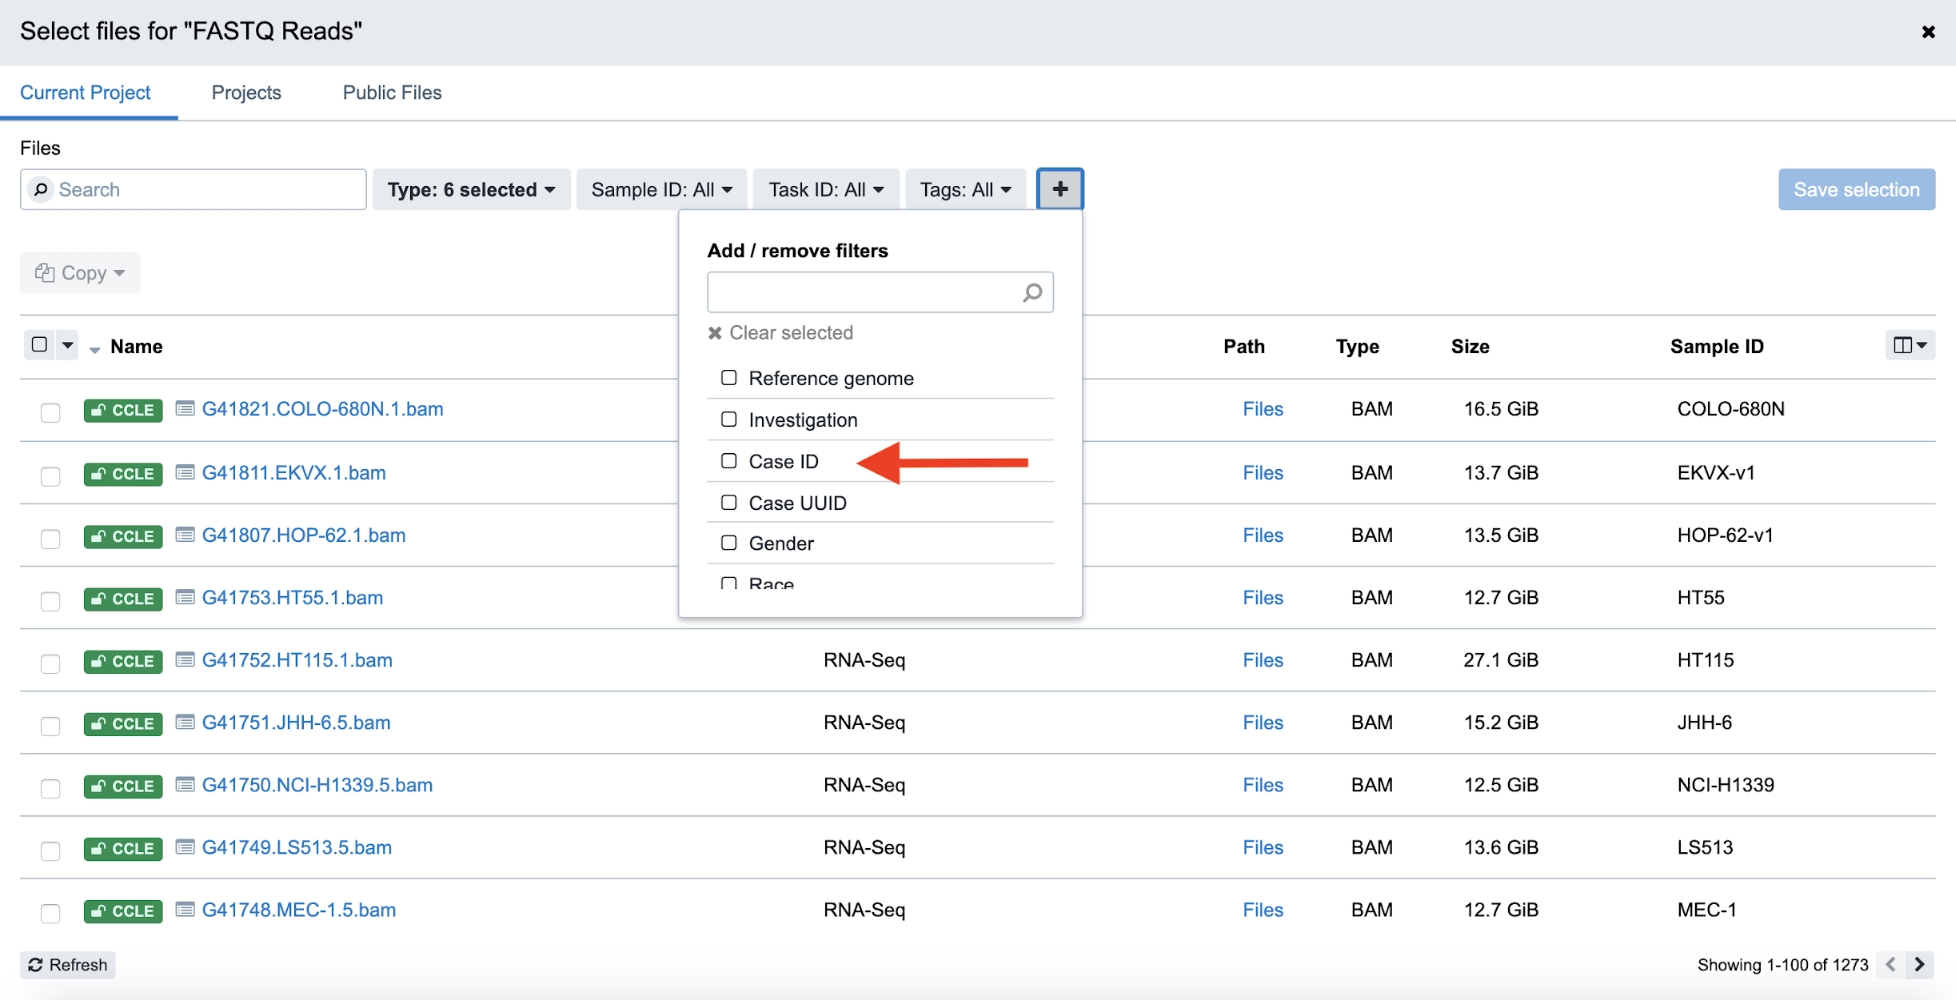
Step 4e. From this menu, select Case ID#. From there, click on the new Case ID filter button, and then select the “CCLE-22Rv1” case from the dropdown menu.
Step 4e: Filtering by Case ID
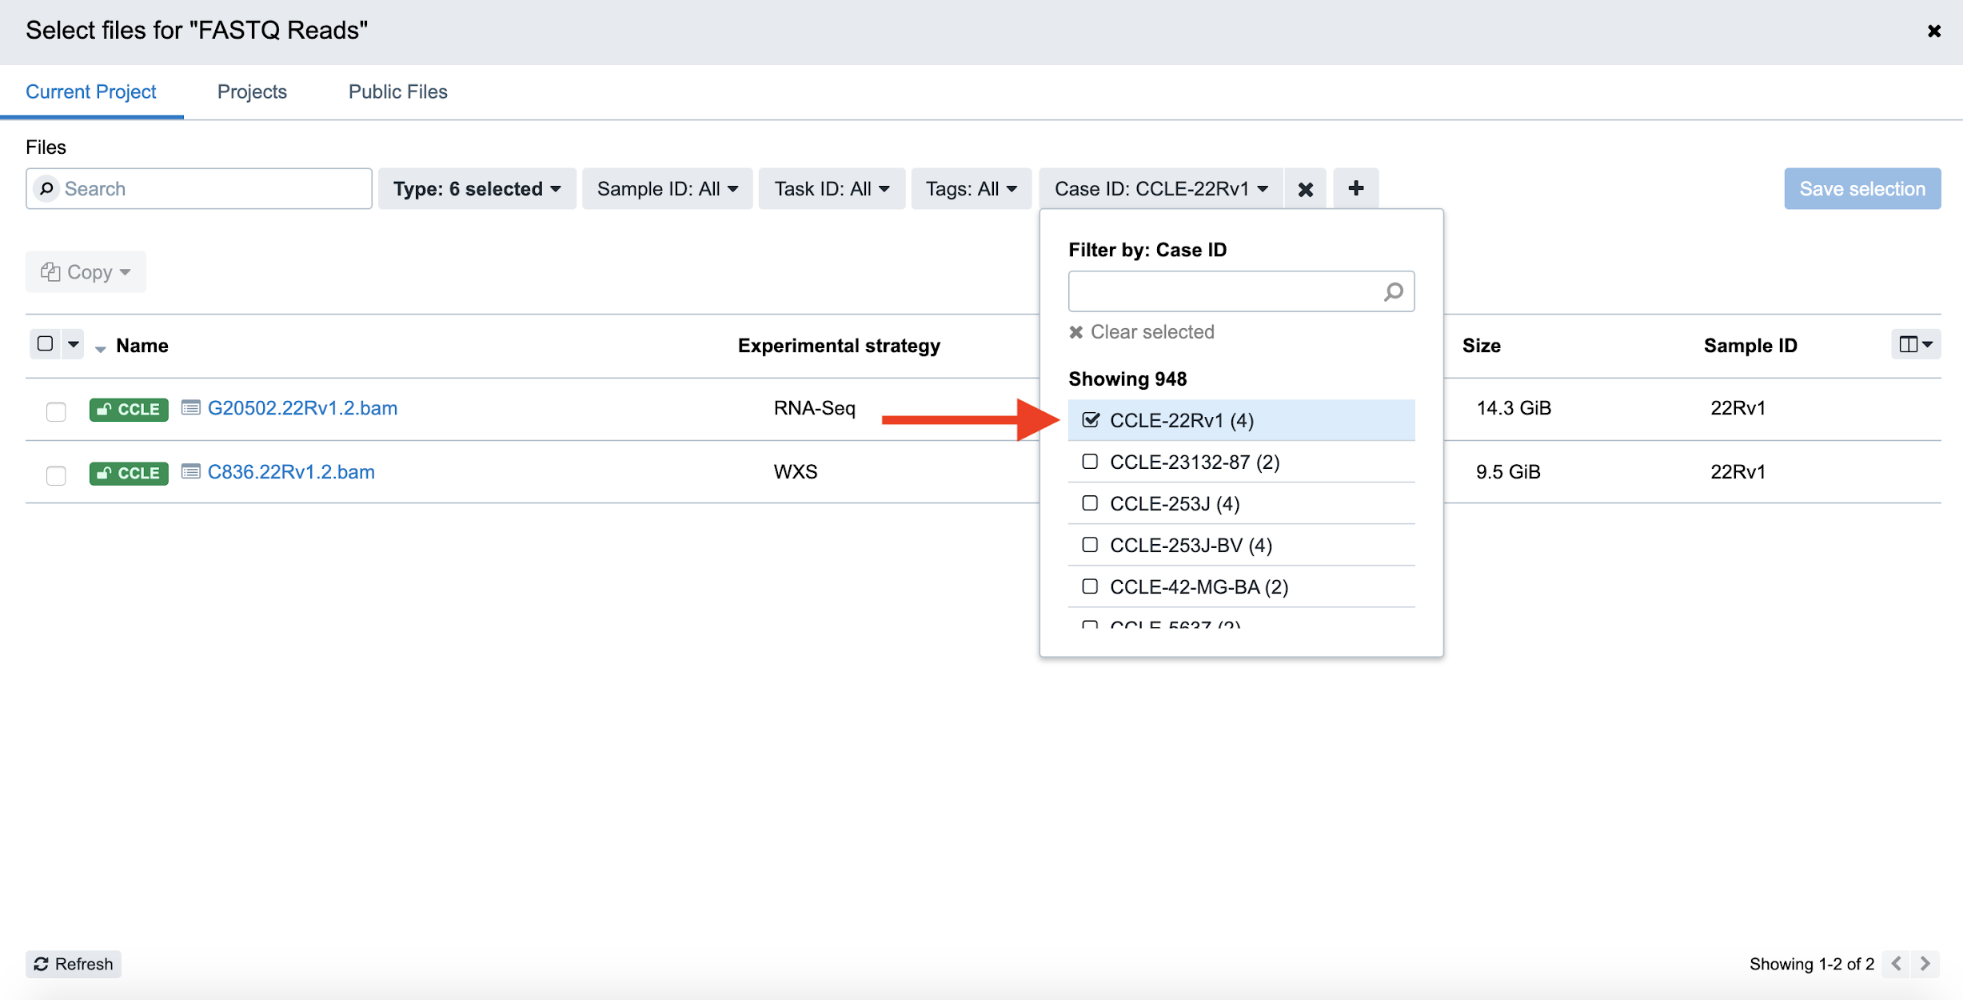
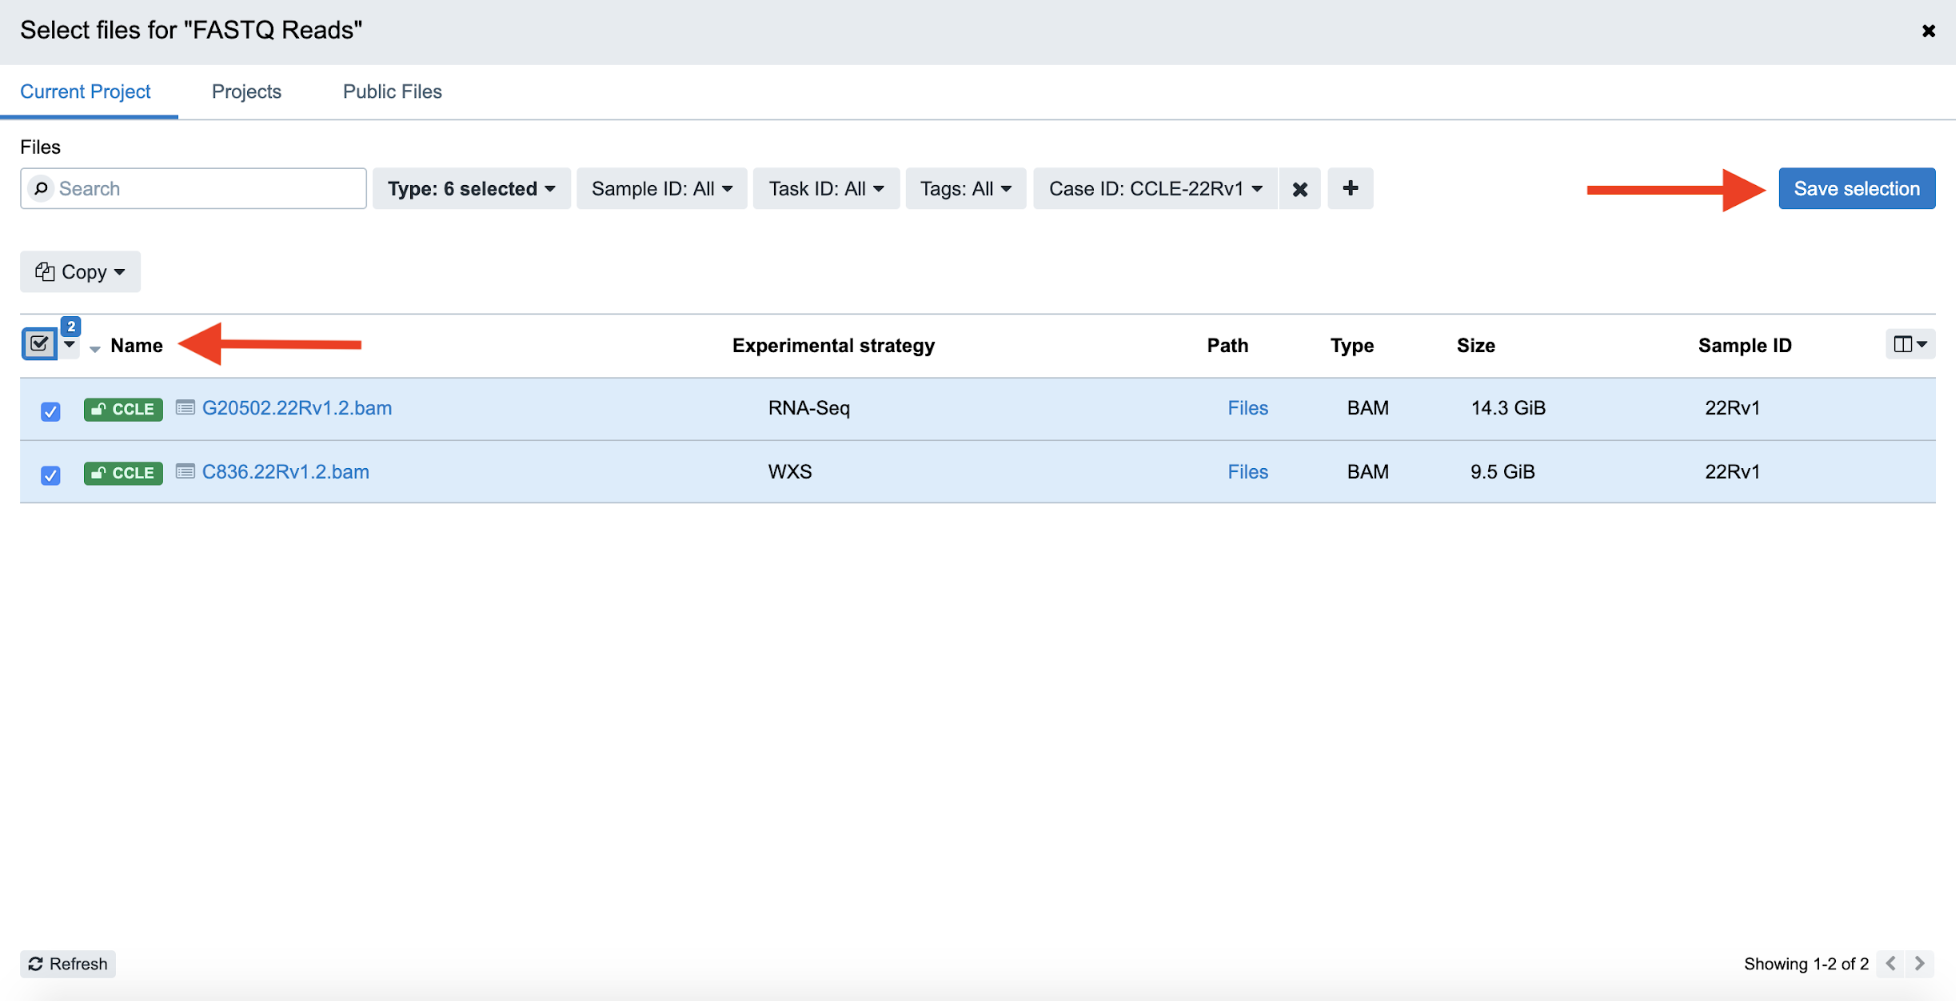
Step 4f. Now, the list of BAM files is filtered down to 2. Click the checkboxes on the left-hand side to select both of these files, and then and click “Save Selection” on the right-hand side to confirm the input file selection.
Step 4f: Selecting Files and Saving Selection
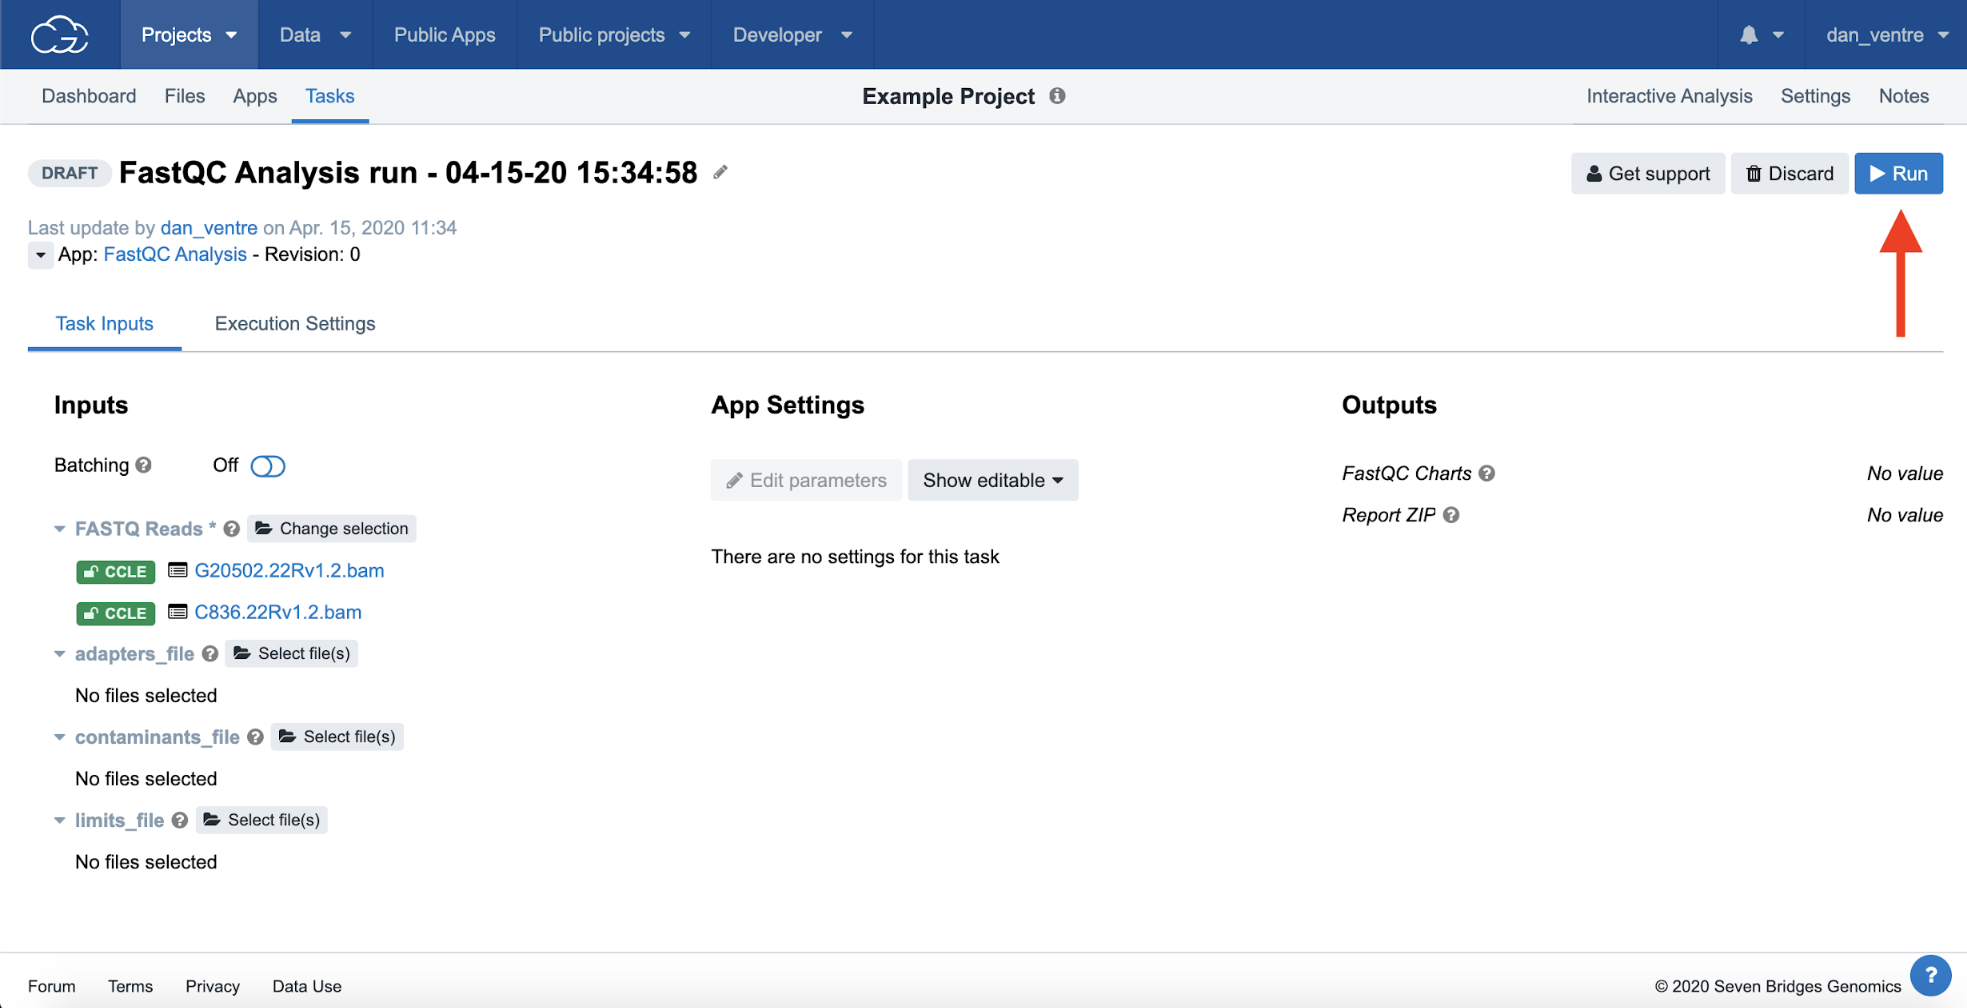
Step 4g. Then click “Run” at the top right-hand side of the screen, and now your Task will queue up to run.
Step 4g: Running the Task
Task Drafted, before clicking “Run”
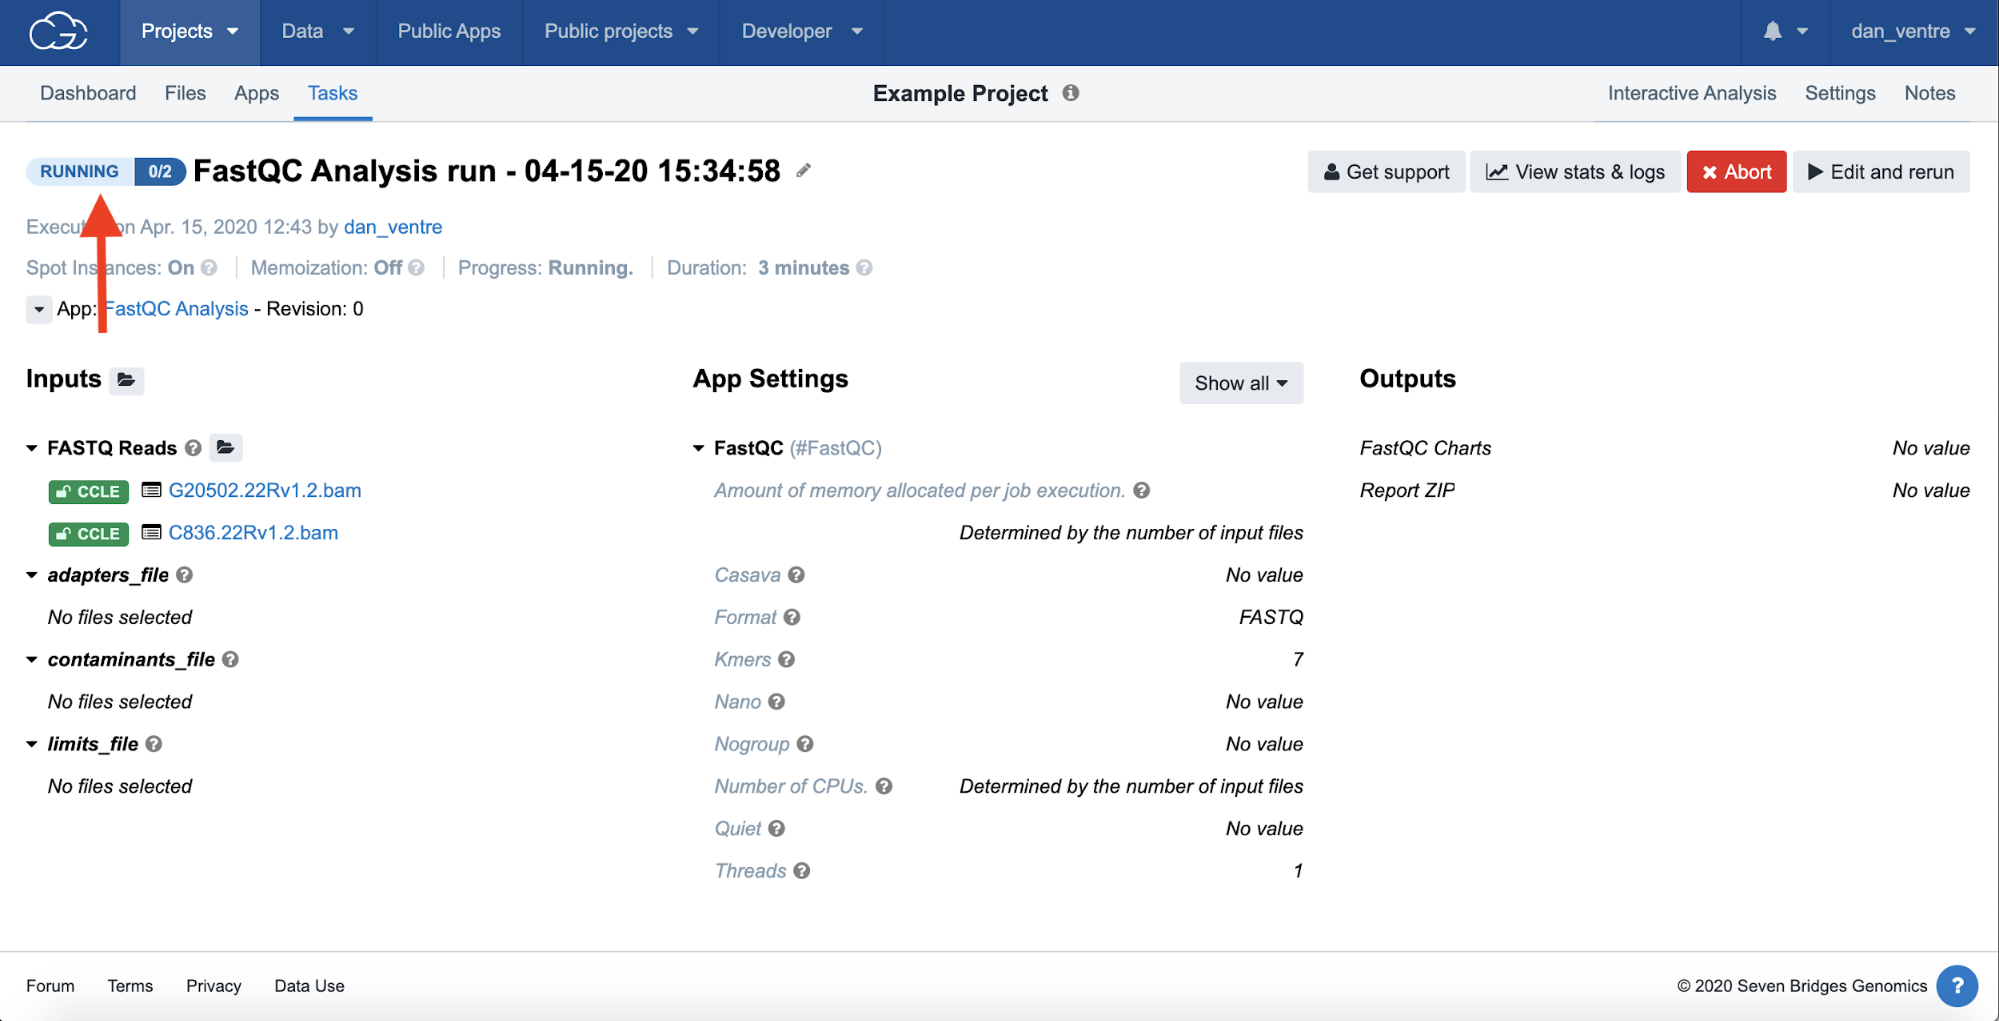
Task Currently Running, status shown on the left side
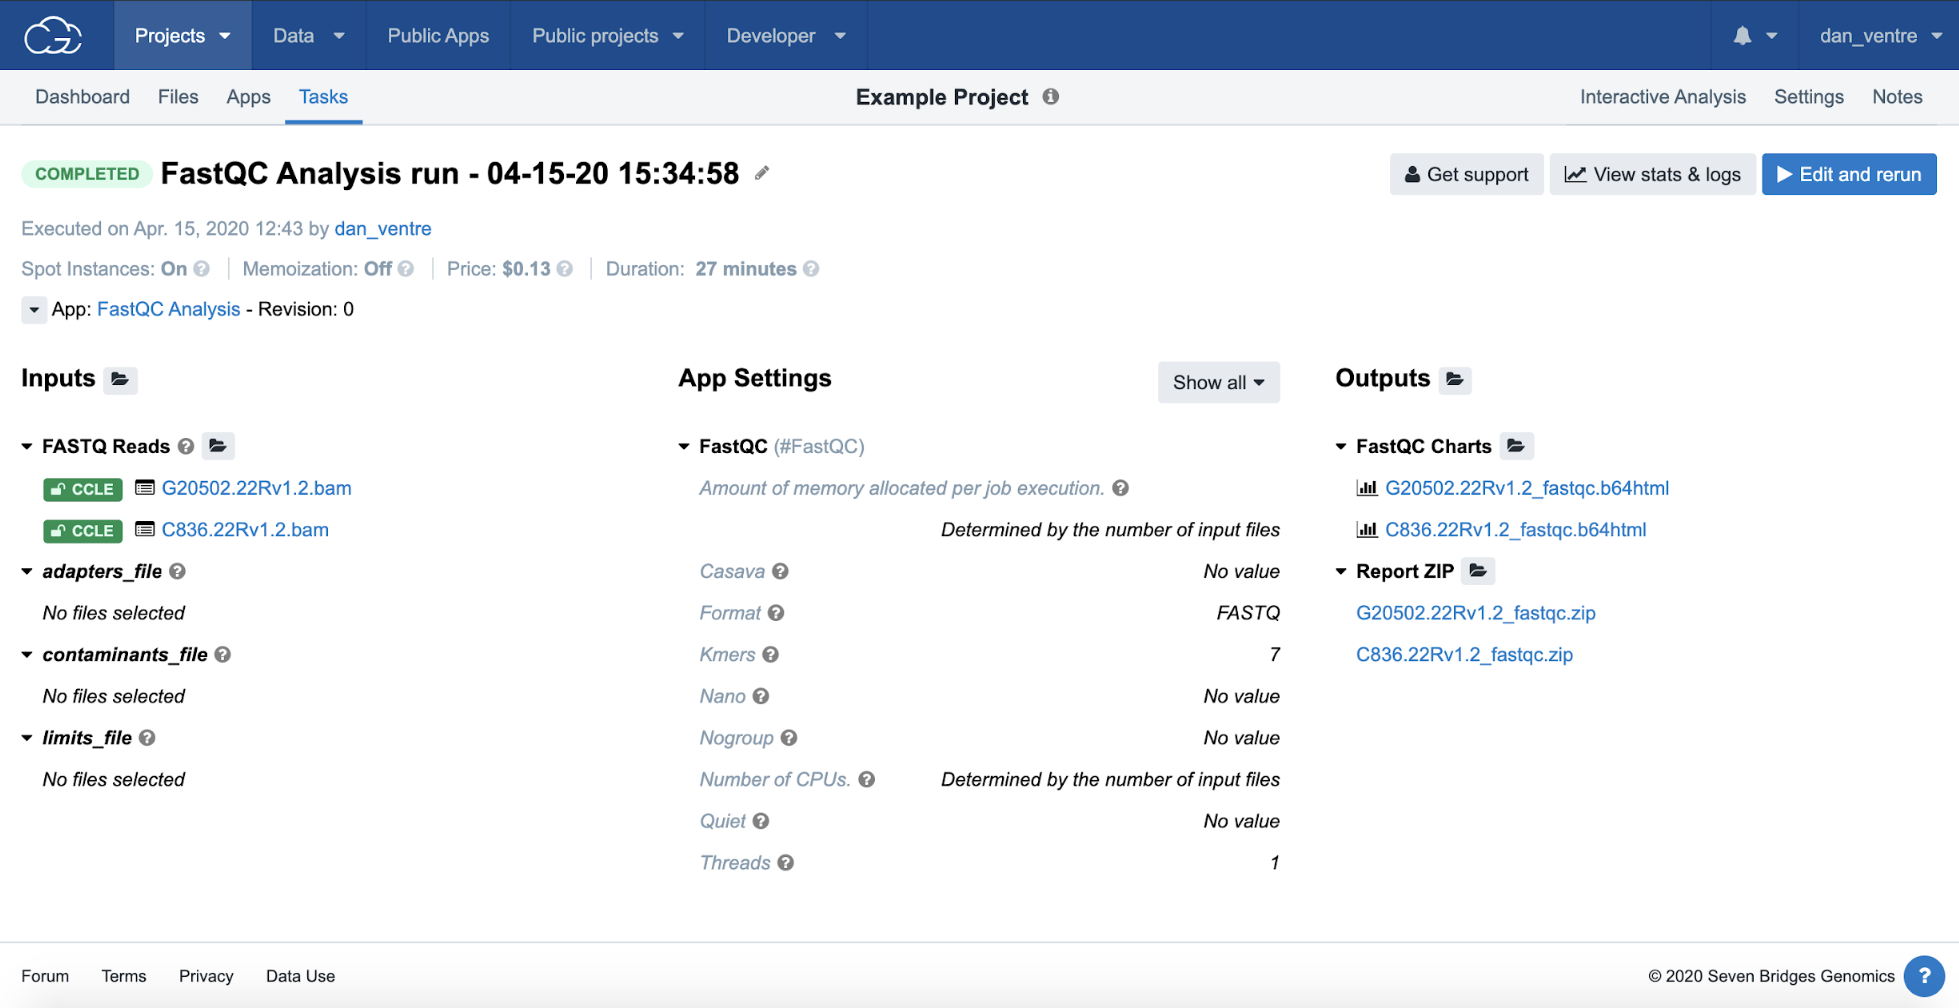
The completed Task and output file links are shown in the second image. We estimate that this example analysis will take approximately 30 minutes to complete.
Completed FastQC Analysis
Completed analyses and next steps
And voila! You have completed your first workflow on the Cancer Genomics Cloud! Now that you have successfully completed the examples in this guide, you now have the knowledge you need to try these analyzes on your own data. If you are interested in learning more about the various features of the Cancer Genomics Cloud, please see our Knowledge Center for more information. To learn more about the different exciting features Seven Bridges has to offer and to learn more about how you can leverage our platform to supercharge your research workflow, see our blog post series here.
Interested in working with controlled data? To learn more about gaining access to controlled data for your research, see here.