
MCMICRO - End to End Microscopy Image Processing
GENERAL PIPELINE USAGE
A user has two options for starting an analysis using MCMICRO:
- Create a project and upload raw image files (.tiff, .tif, .ome.tiff are currently the only supported formats), navigate to the “Public Apps Gallery” and search for MCMICRO then copy it to your project.
- Navigate to the Public Projects Gallery, find “MCMICRO” and copy the project to your own workspace. From there, navigate to “tasks”, then “re-run” to reproduce any of the already-completed analyses.
Please note: Users will soon also be able to interact with the MCMICRO pipeline via Galaxy instance running on the CGC.
INPUT
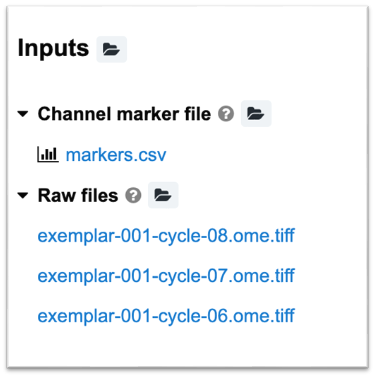
At the minimum, the pipeline expects two inputs
markers.csv- Raw images
Markers
The file markers.csv must be in a comma-delimited format and contain a column titled marker_name that defines marker names of every channel:
Example markers file:
cycle,marker_name
1,DNA_1
1,AF488
1,AF555
1,AF647
2,DNA_2
2,A488_background
2,A555_background
2,A647_background
3,DNA_3
3,FDX1
3,CD357
3,CD1D
All other columns are optional but can be used to specify additional metadata (e.g., known mapping to cell types) to be used by individual modules.
Raw images
The exemplar raw files are in the open standard OME-TIFF format, but in practice your input files will be in whatever format your microscope produces. The pipeline supports all Bio-Formats-compatible image formats, but additional parameters may be required.
(Optional) Illumination corrected images
Pre-computed flat-field and dark-field illumination profiles can be uploaded to your project. If no pre-computed profiles are available, MCMICRO can compute these using BaSiC.
An example of the typical inputs for a MCMICRO run are depicted below:
SUPPLYING PARAMETERS TO MCMICRO
MCMICRO uses default values for any settings not specified as a parameter setting. MCMICRO will resolve conflicting parameter values with a priority list.
Parameters can be supplied on the CGC by defining the “App Settings” on the Task Run page.
Example
An example task with set parameters may look as follows:
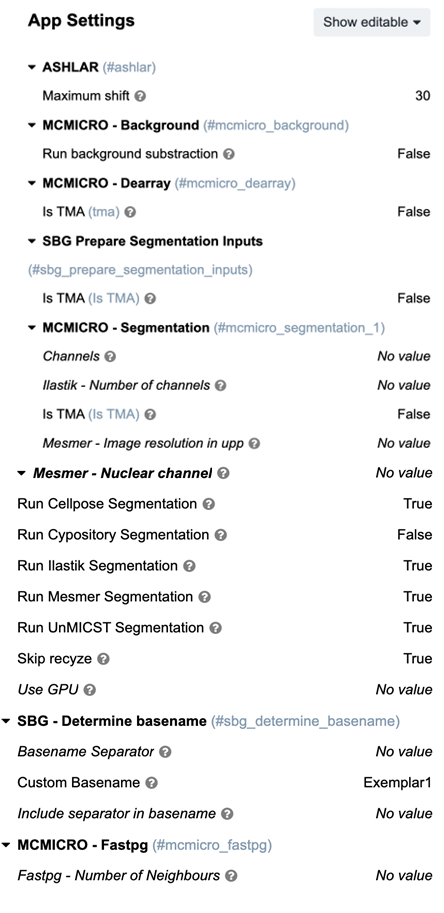
To learn more about each of these modules and settings, go to “MODULE OPTIONS”.
OUTPUT
Stitching and registration
ASHLAR is the default first step of the pipeline. ASHLAR will aggregate individual image tiles from raw/ along with the corresponding illumination profiles to produce a stitched and registered mosaic image.
This mosaic image will be published to the files/Examplar1 subdirectory:
Exemplar1
├── illumination/
    └── exemplar-001-cycle-08.ome-ffp.tif
    └── exemplar-001-cycle-08.ome-dfp.tif
    └── exemplar-001-cycle-07.ome-ffp.tif
    └── exemplar-001-cycle-07.ome-dfp.tif
    └── exemplar-001-cycle-06.ome-ffp.tif
    └── exemplar-001-cycle-06.ome-dfp.tif
├── quantification/
├── segmentation/
├── viz/
├── downstream/
The output filename will be generated based on the name of the project directory.
(Optional) TMA dearray
When working with Tissue Microarrays (TMA), Coreograph is used for TMA dearraying. The viz/ folder will contain an image of the entire TMA. Turn on the tma setting on the task page to have MCMICRO identify and isolate individual cores.
Each core will be written out into a standalone file in the viz/ subdirectory along with the mask specifying where in the original image the core appeared:
Exemplar1
├── illumination/
├── quantification/
├── segmentation/
├── viz/
    └── Exemplar1_reg.ome/
     └── index.html
├── downstream/
All cores will then be processed in parallel by all subsequent steps.
Segmentation
Cell segmentation is carried out in two steps. First, the pipeline generates probability maps that annotate each pixel with the probability that it belongs to a given subcellular component (nucleus, cytoplasm, cell boundary) using UnMICST (default) or Ilastik. The second step applies standard watershed segmentation to produce the final cell/nucleus/cytoplasm/etc. masks using S3segmenter.
The two steps will appear in downstream/scimap*/ and segmentation directories, respectively. When there are multiple modules for a given pipeline step, their results will be subdivided into additional subdirectories:
Exemplar1
├── illumination/
├── quantification/
├── segmentation/
  └──Exemplar1_reg.ome_Ilastik_cell.ome.tif
├── viz/
├── downstream/
  └── scimap_Exemplar1_reg__Ilastik_cell/
    └── plots/
Quantification
The final step, MCQuant, combines information in segmentation masks, the original stitched image and markers.csv to produce Spatial Feature Tables that summarize the expression of every marker on a per-cell basis, alongside additional morphological features (cell shape, size, etc.).
Spatial Feature Tables will be published to the quantification/directory:
exemplar-001
├── ...
├── segmentation/
└── quantification/
    ├── Exemplar1_reg__Ilastik_cell.csv
    └── Exemplar1_reg__Ilastik_nuclei.csv
Each .csv file will contain the following columns:
CellID- cell index that is extracted from the segmentation mask- All columns with names matching those in
markers.csv- average intensity of that channel in the cell/nuclei area - All other columns will contain morphological features.
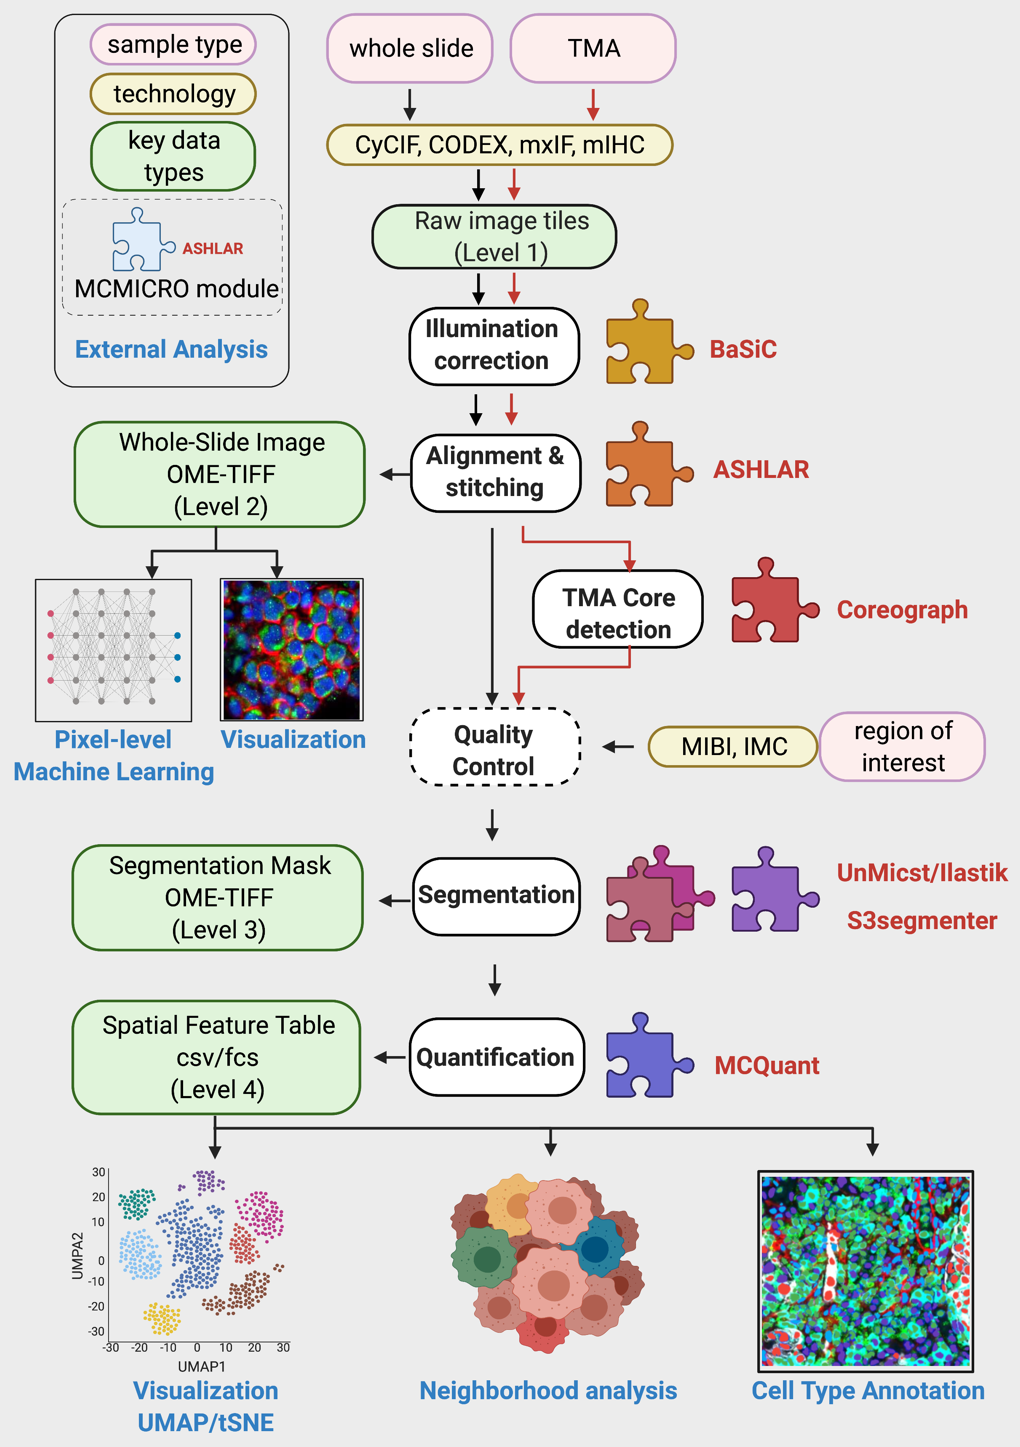
DIRECTORY STRUCTURE
Upon the full successful completion of a pipeline run on the CGC, the directory structure will follow Fig. 1A in the MCMICRO manuscript:
Note: This directory should correspond directly to the CWL workflow. For the Nextflow or Galaxy workflow, the intermediaries and output files should be identical, but the organization of the files within directories and the filenames will be different.
Schematic
Directory Structure
Exemplar1
├── illumination/
├── quantification/
├── segmentation/
├── viz/
├── downstream/
The name of the parent directory (e.g., Exemplar1) can be specified by the user on the task run page. Otherwise, it is assumed by the pipeline to be the sample name.
MODULE OPTIONS
Parameters under the Task Run page regulate the function of individual modules in the pipeline. Parameters are matched to the appropriate module.
Core Modules
All modules in MCMICRO are available as standalone executable Docker containers. When running modules within MCMICRO, the inputs and outputs will be handled by the pipeline and do not need to be specified explicitly.
BASIC
Illumination correction
Description
The module implements the BaSiC method for correcting uneven illumination, developed externally by (Peng et al., 2017). The module doesn’t have any additional parameters.
Usage
By default, MCMICRO skips this step as it requires manual inspection of the outputs to ensure that illumination correction does not introduce artifacts for downstream processing.
ASHLAR
Stitching and registration
Description
The module performs simultaneous stitching of tiles and registration across channels. Check the ASHLAR website for the most up-to-date documentation.
Usage
MCMICRO runs ASHLAR by default.
Maximum allowed per-tile corrective shift in microns (default: 15), can be altered on the Task Run page.
Running outside of MCMICRO: ASHLAR website.
COREOGRAPH
TMA core detection and dearraying
Description
The modules use the popular UNet deep learning architecture to identify cores within a tissue microarray (TMA). After identifying the cores, it extracts each one into a separate image to enable parallel downstream processing of all cores.
Usage
By default, MCMICRO assumes that the input is a whole-slide image.
Set Is TMA: true on the Task Run page to indicate that the input is a TMA instead.
Running outside of MCMICRO: Instructions.
SEGMENTATION
Image segmentation - probability map generation
There are several options for image segmentation on the CGC MCMICRO workflow.
Set any of the following segmentations algorithms to True on the Task Run page to run the segmentation.
Run Cellpose Segmentation
Run Cypository Segmentation
Run Ilastik Segmentation
Run Mesmer Segmentation
Run UnMICST Segmentation
For information on the aforementioned segmentation algorithms, read on.
Cellpose
Description
Cellpose is a deep learning segmentation algorithm able to segment the nuclear or cytoplasmic compartments of the cell. Publications of this algorithm can be found in 1 and 2. A thorough documentation of the script and CLI can be found here.
Usage
To use this segmentation method set Run Cellpose Segmentation: True in the App Settings of the Task Run page.
Running outside of MCMICRO: Github, Instructions.
Cypository
Description
Cypository is used to segment the cytoplasm of cells. Check the GitHub repository for the most up-to-date documentation.
Usage
To use this segmentation method set Run Cypository Segmentation: True in the App Settings of the Task Run page.
Ilastik
Description
The module provides a command-line interface to the popular ilastik toolkit and serves as another method for generating probability maps that can be used as an alternative to UnMICST. Check the GitHub for the most up-to-date documentation.
Usage
To use this segmentation method set Run Ilastik Segmentation: True in the App Settings of the Task Run page. Specify numbers of channels to use. If specific channels are not given, channels in range(0,num_channels) are used in ilastik.
Optional arguments
| Name | Description | Default Value |
|---|---|---|
\--number of channels | The numerical index of the channel(s) from nuclear-image to select. | 0 |
Mesmer
Description
The Mesmer module provides an alternative segmentation approach to UnMicst and ilastik. It is implemented and maintained by an external group. Check their GitHub repository for the most up-to-date information.
Usage
To use this segmentation method set Run Mesmer Segmentation: True in the App Settings of the Task Run page.
Additional Mesmer parameters can be provided in the App Settings of the Task Run page.
Running outside of MCMICRO: Instructions.
Optional arguments
| Name | Description | Default Value |
|---|---|---|
\--nuclear-channel | The numerical index of the channel(s) from nuclear-image to select. If multiple values are passed, the channels will be summed. | 0 |
\--image-mpp | The resolution of the image in microns-per-pixel. A value of 0.5 corresponds to 20x zoom. | 0.5 |
UnMICST
Description
UnMICST uses a convolutional neural network to annotate each pixel with the probability that it belongs to a given subcellular component (nucleus, cytoplasm, cell boundary). Check the UnMICST website for the most up-to-date documentation.
Usage
MCMICRO applies UnMicst to all input images by default. To use this segmentation method set Run UnMICST Segmentation: True in the App Settings of the Task Run page.
SCIMAP
Spatial analysis
Description
SCIMAP is a suite of tools that enables spatial single-cell analyses. Check the SCIMAP website for the most up-to-date documentation.
Usage
MCMICRO allows users to automatically apply SCIMAP’s clustering algorithms to the cell-by-feature table produced by MCQuant. The clustering results can be subsequently used for manual assignment of cell states. Since MCMICRO stops at MCQuant by default, users will need to explicitly request that the pipeline continues to the clustering step. MCMICRO’s usage of SCIMAP doesn’t have any parameters, and users are encouraged to check the SCIMAP website for more sophisticated human-in-the-loop analyses.
Output
- A table of cluster assignments for each cell by the different clustering algorithms implemented within SCIMAP. These tables will be generated in
.csvand.h5adformats. - A set of UMAP plots for the different clustering algorithms, with individual plots written to the
plots/subdirectory in.pdfformat.
CLUSTERING
Description
MCMICRO integrates three methods for clustering single-cell data. These are FastPG (Fast C++ implementation of the popular Phenograph method), Leiden community detection via scanpy, and FlowSOM.
Usage
MCMICRO applies these methods to the workflow by default.
Running outside of MCMICRO:
Output
All methods output a .csv file annotating individual cells with their cluster index. Nextflow will write these files to the plots/ subfolder within the project directory.
Updated over 2 years ago