↳ Data Browser query structure
QUERY DATASETS >About the Data Browser > Data Browser feature query structure
Overview
Learn about selecting datasets for your query and filtering by metadata properties. Get an overview of your query results and use them in your projects on the Platform.
Choose your datasets
Open the Data Browser to display the datasets available for querying, such as the TCGA GRCh38, TARGET, and CPTAC datasets. Choose one or more datasets to query. Note that you can only query harmonized datasets together.
Note that all CGC users can use the Data Browser to query each of the available datasets. In order to use Controlled Data, however, you will need Controlled Data access via the dbGaP.
Start your query
To start your query, use either of the following options.
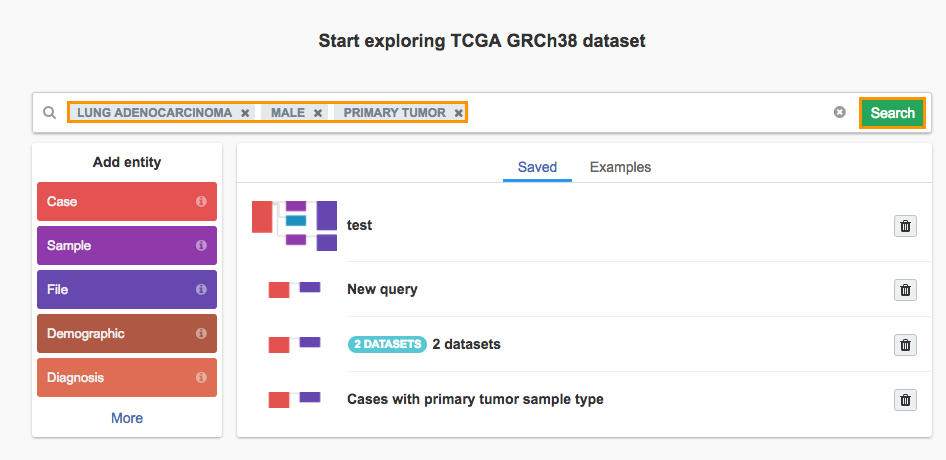
Start by searching through a dataset
To search through a dataset you have selected, you can build a query using a variety of search terms. The intuitive autocomplete search functionality uses your terms to suggest pre-built queries. Select a query and continue to edit it on the Data Browser canvas.
Start from an entity
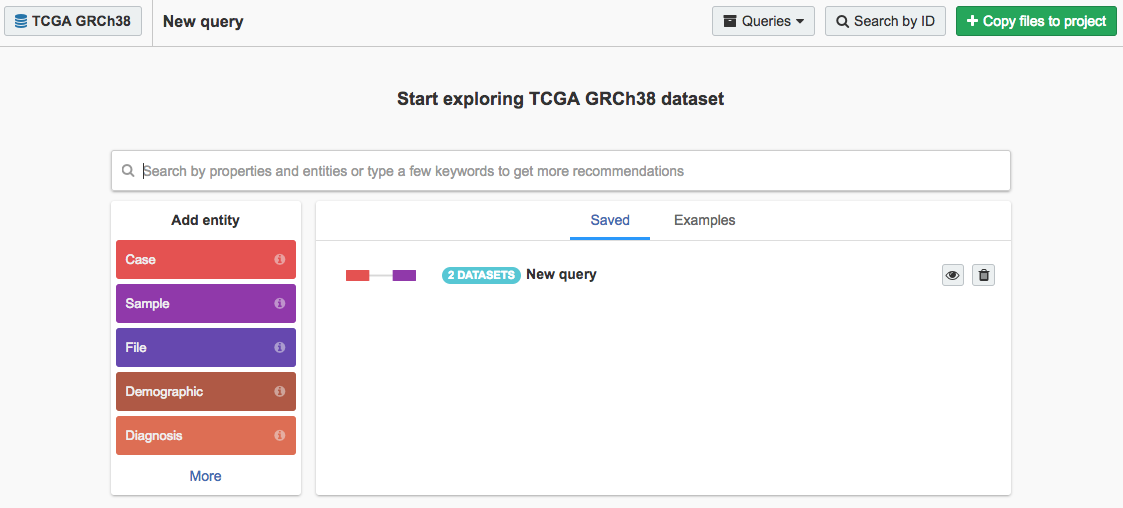
The entities of the datasets you selected are displayed on the Data Browser when you first open it, as shown below. Simply click on an entity, such as Case below, to start a new query.
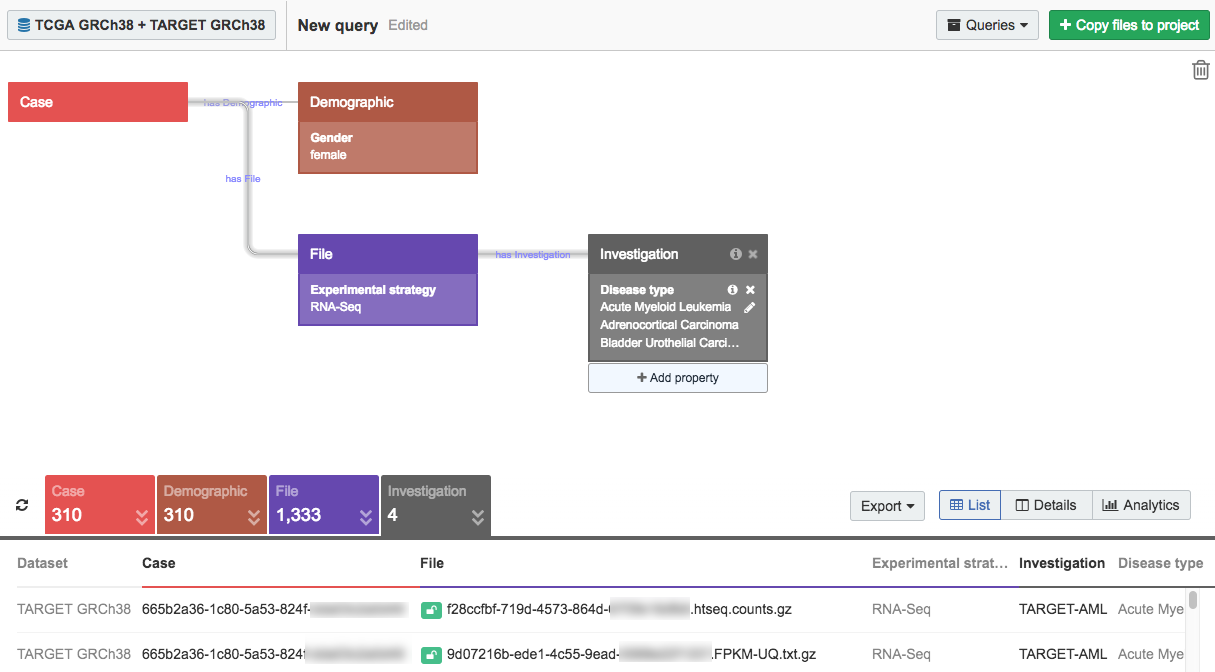
Add entities by clicking on a previously added entity. A list of entities associated with the first one appears, as shown below. For instance, a Case can have associated Files (about the case), Samples (taken from the patient), and Drug therapies (given to the patient). Hover over an entity for more information.
Filter by an entity's properties
Once you've selected an entity, you can filter by that entity's properties. Click + Add property below each entity to add filters. Take advantage of the search box's partial matching functionality to generate a list of properties and values to help you get started.
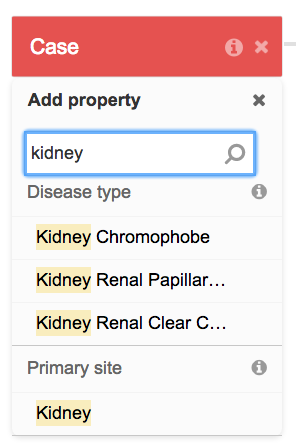
Note that you can edit a property at any time by clicking the pencil icon. You will be unable to add more values for each property otherwise.
View the query results
The table below the Data Browser contains a list of UUIDs for the entities that match your query. This table allows you to review returned results, but it does not allow you to select or filter results. All selection and filtering have to be done via the query on the Data Browser canvas.
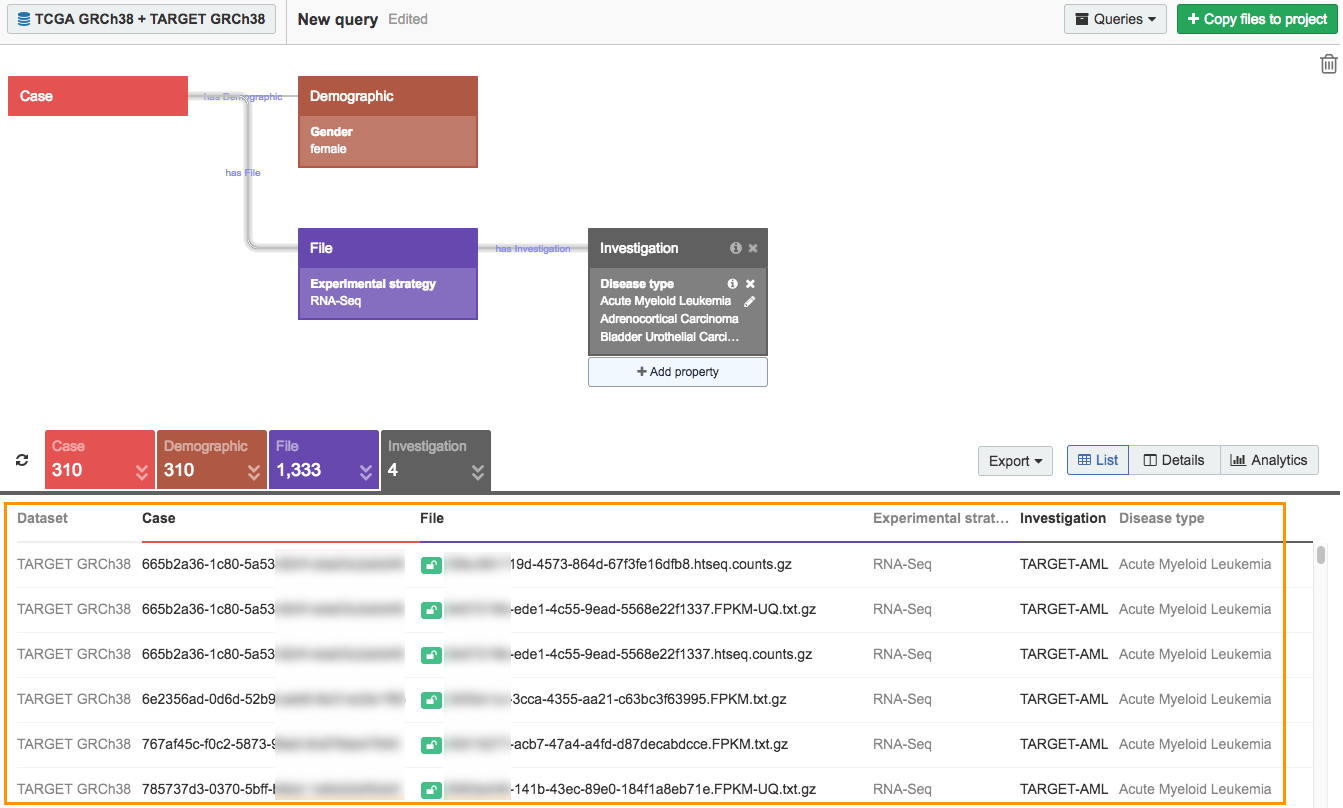
View query results in table format.
If you selected multiple datasets across which to build your query, a visual representation of the distribution of your query results can be displayed instead of the table.
By clicking the Analytics option as shown below, you can see the contribution of each dataset towards the result of your query, plotted by entity.
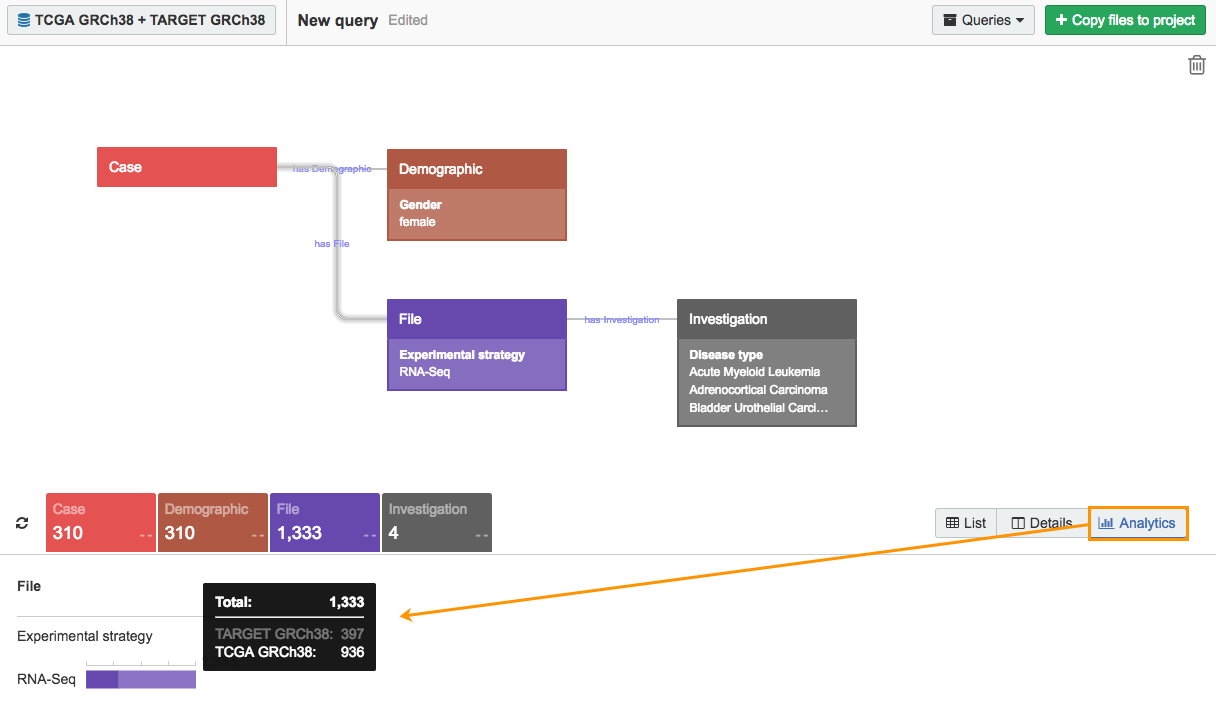
View the distribution of query results across datasets for each entity.
Access data for use in your project
Once you've built a query, you can access the resulting data for use in a project. Learn more about accessing data from the Data Browser.
Updated over 3 years ago
